WebPageTest vs PageSpeed Insights: complete comparison
WebPageTest vs PageSpeed Insights: lab data vs field data, diagnostics vs SEO signal. Comparison, use cases, scripting, API and ecosystem.
Same URL, two diagnostic lenses
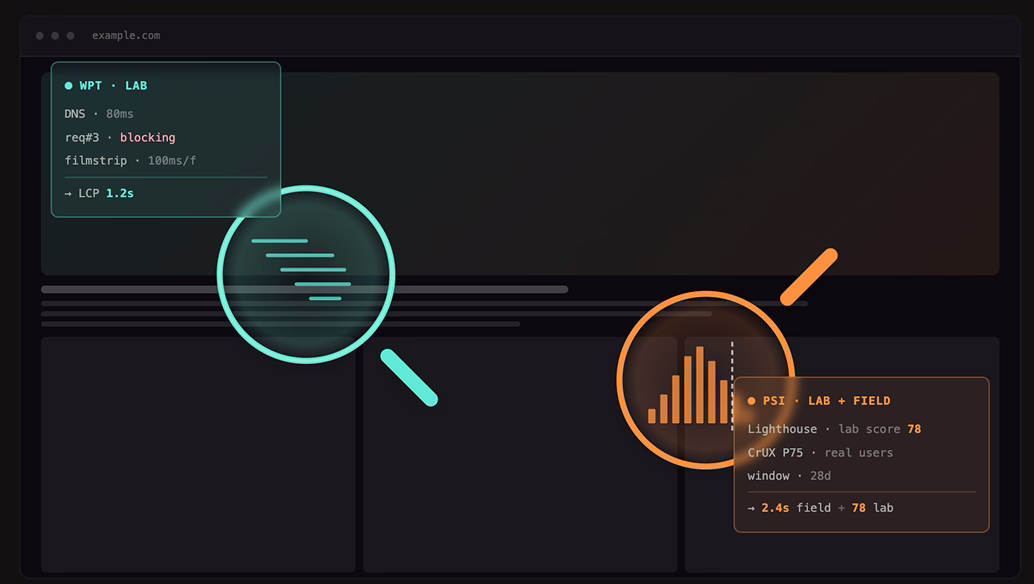
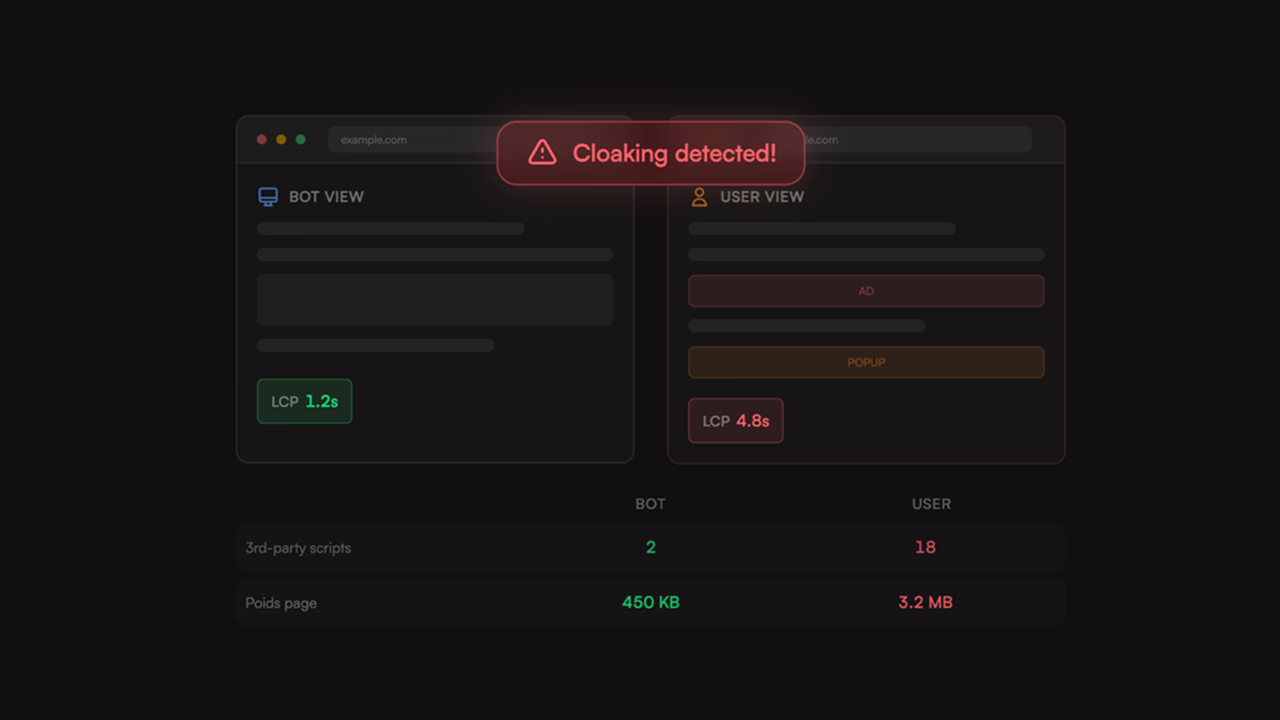
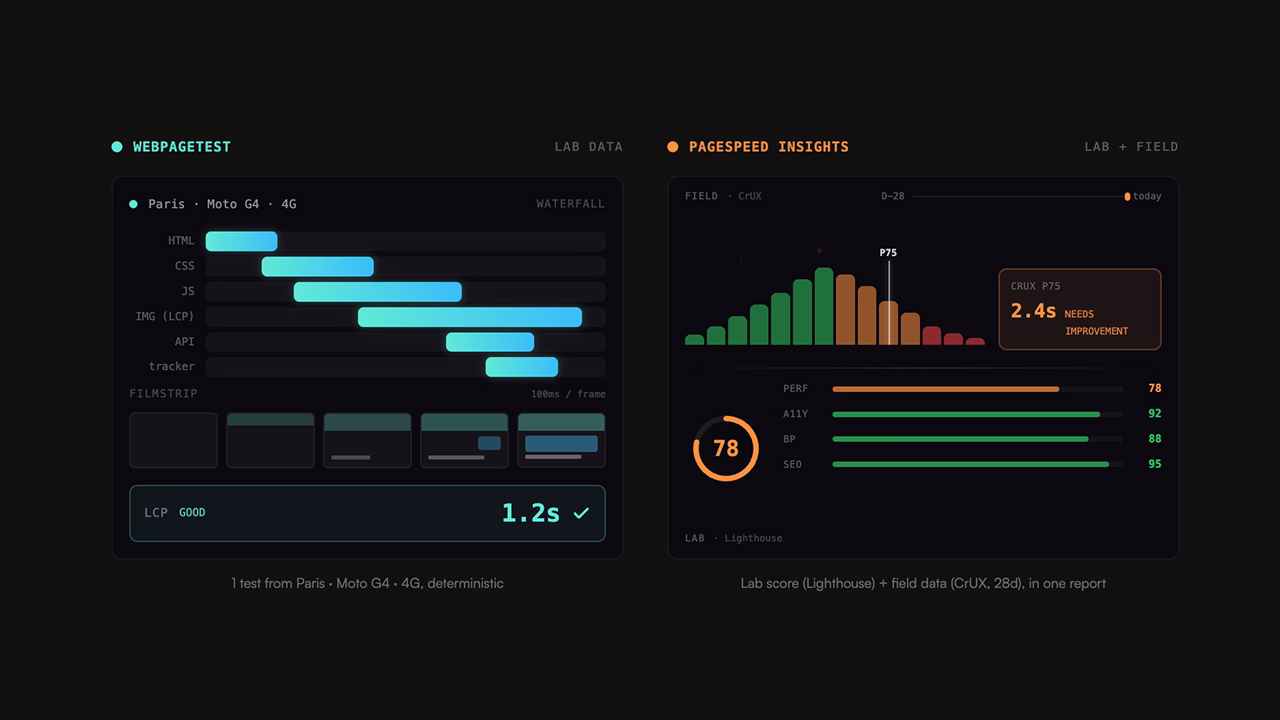
WebPageTest and PageSpeed Insights measure the same thing — how fast a page feels — but they answer two different questions. Both tools surface the CrUX field data (28-day rolling window, 75th percentile) for the URL under test when Chrome has it; on the lab side, PSI runs a single Lighthouse test from one Google datacenter, while WebPageTest spans 30+ physical locations, multi-runs, waterfall, filmstrip, scripting and API. PSI answers "how does Google see my site in 30 seconds?"; WPT answers "why does this page take 4.8 seconds to render from Mumbai?". Using one without the other means diagnosing your site only halfway.
Candidate 1 — duo lab/field
1 test from Paris · Moto G4 · 4G, deterministic
Lab score (Lighthouse) + field data (CrUX, 28d), in one report
Candidate 2 — two loupes
Same URL, two diagnostic lenses
Why picking the right tool changes everything
A performance audit run with the wrong tool produces two textbook symptoms: a Lighthouse score of 95 in PageSpeed Insights while real users see a 4-second LCP on mobile, or — the other way round — a site that passes its Core Web Vitals in the field but stays opaque the moment you try to understand why a regression just landed. The cause is almost always the same: lab data and field data got mixed up, or a synthetic number was treated as user-experience truth.
That's the WebPageTest vs PageSpeed Insights debate — and it isn't won by picking a side. The two tools are complementary, as long as you know which one answers which question.
The fundamental difference: lab data vs field data
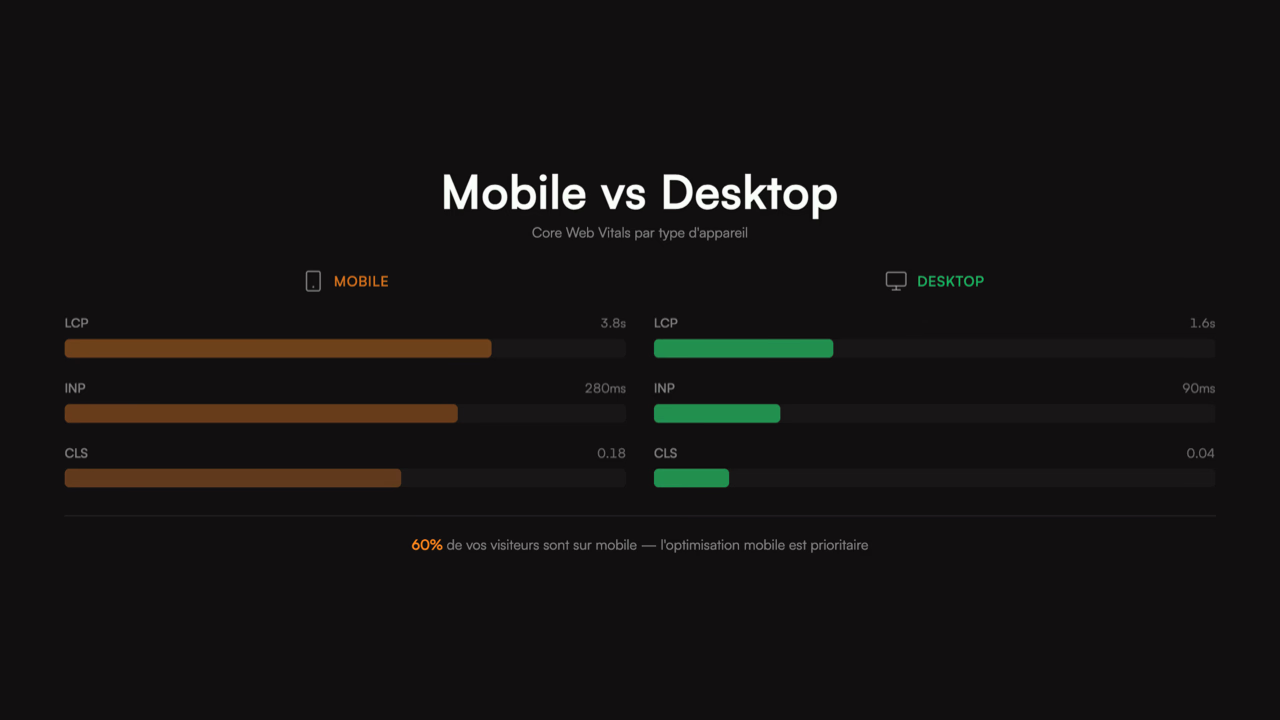
Mobile vs Desktop
Core Web Vitals by device type
60% of your visitors are on mobile – mobile optimization is a priority
This is the axis everything else hangs on. Methodology, metrics, use cases — they all follow from this one distinction.
Lab data: the page is loaded in a controlled browser with a fixed network and CPU profile (e.g. Slow 4G, 4× CPU throttling). One run gives you a reproducible number. That's what WebPageTest and Lighthouse produce. Upside: deterministic, ideal for before/after comparisons or catching a regression on a commit. Downside: a single synthetic scenario that doesn't reflect the diversity of real devices and connections.
Field data: metrics collected from actual Chrome user loads (CrUX, Chrome User Experience Report), aggregated over a rolling 28-day window and reported at the 75th percentile. That's what PageSpeed Insights shows in its "Real-world data" block — and that's what Google uses as a Page Experience signal. Upside: it's reality. Downside: 28-day lag, and no way to drill down into a specific session.
| Criterion | Lab data (WPT, Lighthouse) | Field data (CrUX, PSI) |
|---|---|---|
| Source | Controlled browser | Real Chrome users |
| Reproducibility | High (one run = one number) | Statistical (P75 over 28 days) |
| Latency | Immediate | 28-day rolling |
| Diagnosis | Waterfall, traces, profiles | Aggregate metrics only |
| CI regression tracking | Ideal | Unsuitable (too slow) |
| Google SEO signal | Indirect | Direct (Page Experience) |
An important nuance to keep in mind: both tools surface CrUX data for the URL under test when Chrome has enough traffic on it. Kicking off a WPT run at time T pulls up the CrUX block just like PSI does, since both hit Google's CrUX API. The comparison isn't really "lab vs field" as it's often simplified to ; it's "very deep lab + field" (WPT) vs "fast lab + field, one-click access" (PSI).
Practical takeaway: PSI tells you whether there's a problem, WPT tells you why. A performance fix is only definitively validated in field data — but it's built in lab data.
WebPageTest: what it does best
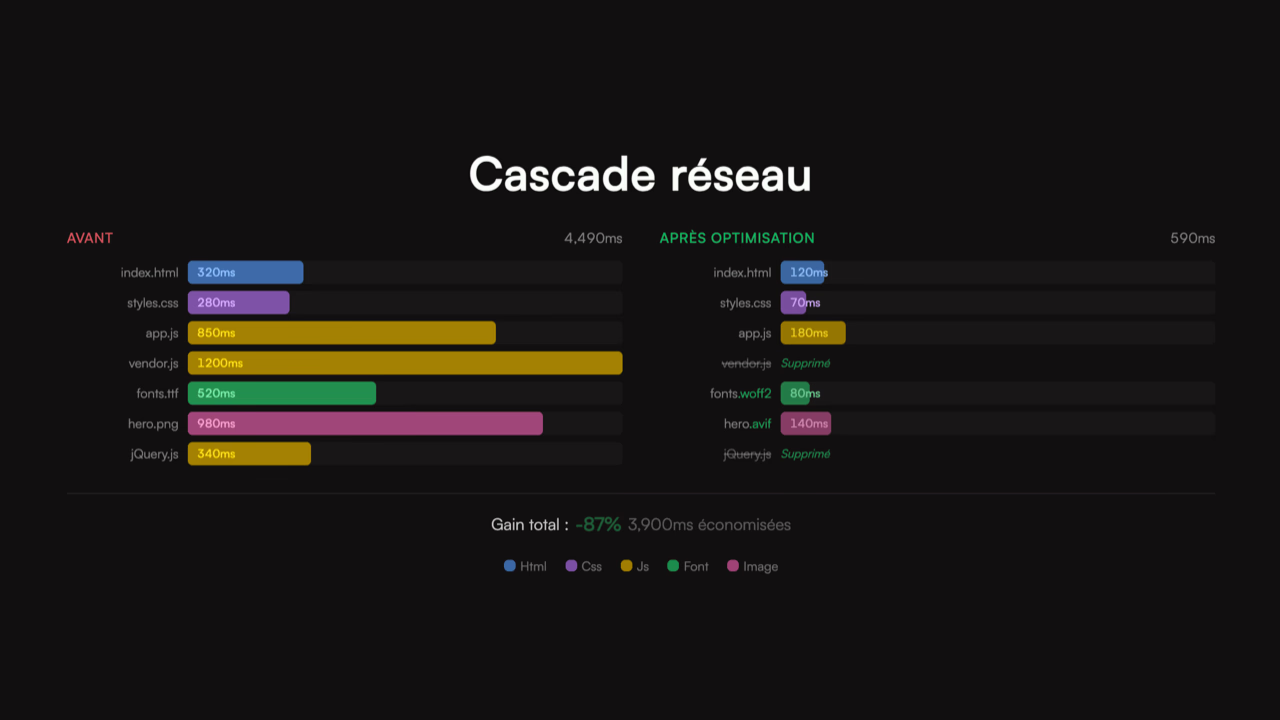
Network waterfall
WebPageTest (WPT), now owned by Catchpoint, is first and foremost a lab data tool — with the deepest diagnostic toolset on the market — and its report also surfaces the CrUX block for the URL under test when Chrome has the data, exactly like PSI. It's the gold standard for synthetic testing, across several layers.
On the infrastructure side, the free Starter plan gives access to 30 locations worldwide — including mainland China — on real physical devices (Moto G4, iPhone, Chrome desktop profiles). The Pro plan unlocks 35 locations total, with queue priority and premium locations. That's how you discover that a site loading in 1.2 s from Paris can show 4.8 s from Mumbai on the very same Moto G4 — a gap that's invisible to any single-location tool. For a site serving multiple geographies, it's non-negotiable.
On the visual diagnosis side, the waterfall breaks down each request into DNS, connect, TLS, TTFB and download: you immediately see the request blocking your LCP, the preload that wasn't honored, the third-party script delaying another critical asset. The filmstrip records the visual state of the page every 100 ms (configurable up to 60 fps) and produces a video: you pinpoint exactly when the hero appears, when a layout shift fires, at which frame the "Add to cart" button becomes clickable. PSI only provides an end-of-load screenshot.
Beyond Core Web Vitals, WPT exposes the Speed Index (introduced by Pat Meenan in 2012, a weighted visual completeness metric), TTFB, Start Render, Total Blocking Time, and your own User Timings — any mark created via performance.mark() shows up in the report automatically. You can also inject custom JavaScript to measure whatever has no standard metric (time until the cart becomes interactive, DOM size at a given moment, presence of a specific element). To filter network noise, multi-run testing (3 by default, configurable) with median is the norm — and several URLs can be compared side by side with synchronized filmstrips, handy for benchmarking against a competitor.
The two features that put WPT in a category of its own are scripting and the API. Scripting lets you audit a page behind a login, or a PDP reached after multiple clicks from the home page — you navigate, fill a form, click, wait, and only record metrics on the target page:
logData 0
setCookie https://example.com session=abc123
navigate https://example.com/login
setValue id=email user@example.com
setValue id=password ***
clickAndWait id=submit
logData 1
navigate https://example.com/dashboard
logData 0 disables recording during setup, logData 1 re-enables it on the page you actually want to measure. Flatly impossible in PSI. The REST API (Pro plan) lets you automate all of this: tests in a CI pipeline, feeding an internal dashboard, triggering on every deploy. It's also what lets WPT integrate with platforms like SpeedCurve or Calibre.
PageSpeed Insights: what it does best
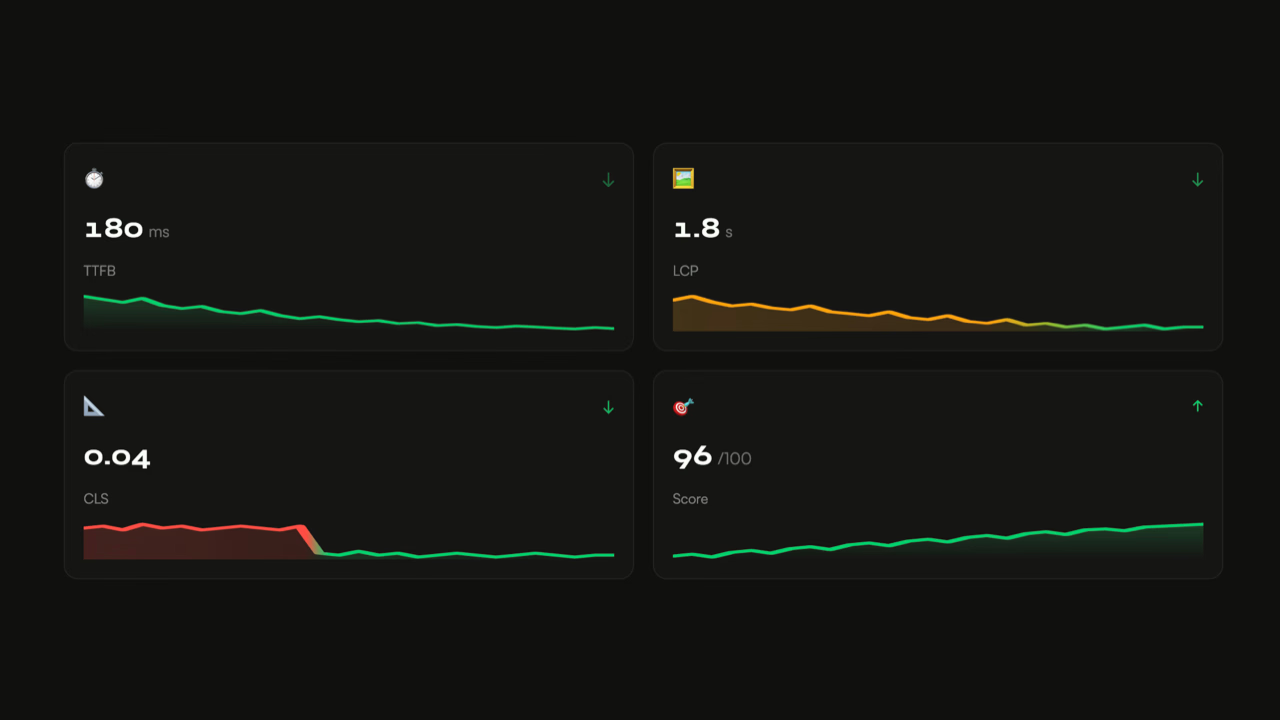
TTFB
LCP
CLS
Score
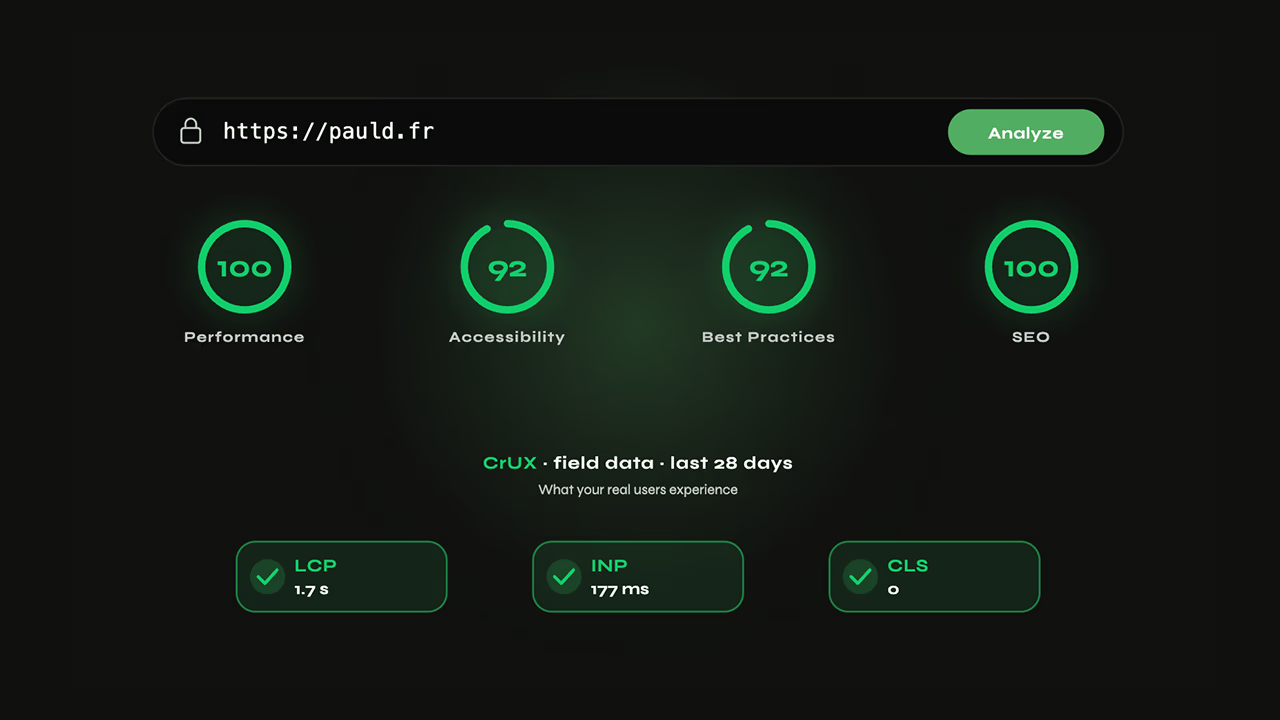
PageSpeed Insights (PSI), owned by Google, has a unique feature: it's the only mainstream tool that combines lab data (a Lighthouse run) and field data (the CrUX block) in the same report. Its two assets sit in that duality — one-click access, no install.
On the field side, the "Real-world data" block at the top of the report shows LCP, INP and CLS measured on real Chrome visits to your URL (or to your origin if the page lacks enough traffic), at the 75th percentile over 28 days. It's the very same data Google uses for the Page Experience signal — no lab audit can produce it.
On the lab side, PSI runs Lighthouse 13 in a Google-controlled environment with a fixed mobile profile (emulated Moto G4, Slow 4G, 4× CPU throttling) and returns a 0–100 score per category (Performance, Accessibility, Best Practices, SEO) along with a list of actionable audits — each audit paired with an estimated gain (ms saved, KB saved) and a root-cause explanation. It's exactly what lighthouse https://example.com produces locally, but with nothing to install.
Access is universal: URL, "Analyze" button, 30 seconds, no account, no technical skill required. It's the tool you share with a product manager or a client. The v5 API (free Google key) extends that accessibility to monitoring: 25,000 requests per day and 400 per 100 seconds — plenty to audit a catalog of several hundred URLs daily, something out of reach on the WPT free plan. And since the API returns both (Lighthouse + CrUX), one call is enough to track lab and field in parallel.
Side-by-side comparison
| Criterion | WebPageTest | PageSpeed Insights |
|---|---|---|
| Data type | Lab (synthetic) | Lab (Lighthouse) + Field (CrUX) |
| Methodology | Tests on physical agents | Lighthouse SaaS + CrUX aggregation |
| Time to result | 1 to 3 min depending on location and queue (Free) | ~30 s, no queue |
| Locations | 30 (free) to 35+ (Pro) | 1 (Google datacenter) |
| Emulated devices | Real (Moto G4, iPhone…) | Emulated (Moto G4) |
| Network profiles | Configurable (3G, 4G, Cable, custom) | Fixed (Slow 4G) |
| Multi-run / median | Yes (3 by default, configurable) | No (1 run) |
| Waterfall | Detailed, interactive | Basic |
| Filmstrip | Yes (100 ms, up to 60 fps) | No (end-of-load capture only) |
| Video | Yes | No |
| Custom metrics / JS injection | Yes | No |
| User Timings | Shown automatically | No |
| Journey scripting | Yes | No |
| Field data (CrUX) | Yes (CrUX block shown in the report if Chrome has the data) | Yes (CrUX, 28 days, P75) |
| API | Pro only (~$18.75/mo) | Free (25,000/day) |
| Authenticated tests | Yes (scripting) | No |
| Price | Free (300 tests/mo) to $180+/mo | Free |
| Actionable recommendations | None — metrics, traces, raw waterfall to interpret | Lighthouse list with estimated gains (ms, KB) — needs filtering; some suggestions are off-target (cut Ads/Analytics scripts, YouTube embeds) |
| Direct Google SEO signal | Indirect | Yes (Page Experience) |
Use cases: which tool for which job
Once the matrix is laid out, the verdict comes by scenario, not by tool.
| Scenario | Tool | Why |
|---|---|---|
| Checking what Google sees for ranking | PSI or WPT | Both surface the same CrUX block (the Page Experience source of truth); PSI is just faster to share with no config |
| Understanding why an LCP is at 4 s | WPT | Waterfall + filmstrip pinpoint the root cause in 5 minutes |
| Auditing a PDP behind a login or a consent banner | WPT (scripting) | PSI can't get past a single step; see also bypassing cookie consent banners |
| Monitoring 200 URLs of a catalog daily | PSI (API) | 25,000 free req/day; WPT free plan caps at 300 tests/month |
| Catching a perf regression on a deployment | WPT | Determinism is non-negotiable in CI; CrUX's 28-day lag disqualifies PSI |
| Testing from Tokyo, Mumbai and São Paulo | WPT | PSI runs only from a single Google datacenter |
| Presenting a report to a non-technical client | PSI | Score 0–100 + colors + CrUX block readable in 30 s with no training |
| Measuring the impact of a CDN change or TTFB optimization | WPT | DNS/connect/TLS/TTFB breakdown visible in the waterfall |
| Testing a multi-page journey (cart → checkout → confirmation) | WPT (scripting) | No equivalent in PSI |
Limits and pitfalls to know about
No single tool tells the whole truth. Four pitfalls show up over and over.
The Lighthouse score is not a direct SEO signal. A 95 in PSI has no influence on ranking — what matters to Google is the CrUX block in the same report, i.e. P75 field data. Optimizing to push the score up without touching the field data is decorative work.
A single WPT run is worthless. The network is noisy, a shared agent's CPU fluctuates; always run at least 3 runs and take the median. On 100–200 ms optimizations, a single run can produce a false positive (or false negative) that costs you a day of work.
The PSI score moves on its own. Three PSI runs 30 seconds apart on the same URL can return 85, 92, 78 without you touching the site — the variance comes from the Google datacenter serving the test, the embedded Lighthouse version (sometimes one or two cycles behind the public Lighthouse CLI), and the shared environment. The takeaway: an isolated score never validates an optimization on its own, and the actionable recommendations need filtering — PSI regularly suggests removing Google Ads, Analytics scripts or YouTube embeds that are actually critical to revenue.
And finally, CrUX can be empty. For a URL to have its own CrUX data, it needs a minimum Chrome traffic threshold. On a low-traffic page, PSI falls back to origin-level data (the whole site) — or shows nothing. Easy to miss if you skim.
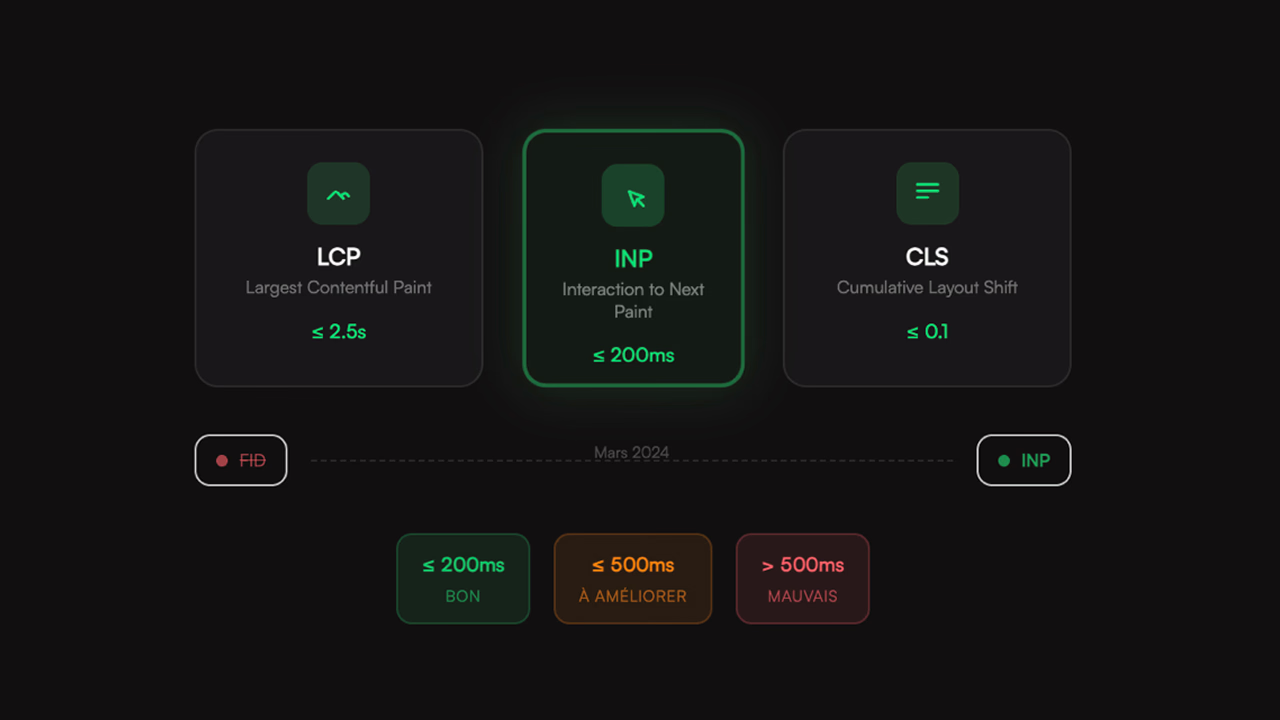
💡 Tips for reading PSI correctly: always check that the "Real-world data" block is on the URL and not on the full origin (a toggle exists). If CrUX is empty, don't conclude performance is good or bad — absence of data is absence of data. And keep in mind that INP replaced FID in the Core Web Vitals in March 2024: if your internal dashboard still tracks FID, you're tracking a dead metric. See [Core Web Vitals: INP replaces FID](https://pauld.fr/en/advices/core-web-vitals-inp-march-2024) for the full context.
The ecosystem around WPT and PSI
Reducing performance tooling to these two tools means missing half the landscape. The neighbors to know, with their respective niches:
| Tool | Type | When to use |
|---|---|---|
| Lighthouse CLI | Lighthouse engine, run locally (npm i -g lighthouse) |
PSI no longer enough, WPT overkill, pipeline integration |
| DebugBear | Commercial platform: Lighthouse + historical CrUX + scheduled tests | Time-series tracking and alerting (the slot missing from PSI) |
| SpeedCurve | WPT + RUM + business-metrics dashboard | Correlate perf with conversion without wiring up the bricks |
| Calibre | Continuous Lighthouse monitoring + user profiles + perf budgets | Product teams |
| Treo.site | Historical CrUX dashboard over 25+ months | Visualize a site's drift over the long term |
| Chrome DevTools (Performance) | Native Chrome profiler (CPU flamegraph, long tasks, live INP) | Go beyond the waterfall, explain line by line |
| Search Console (CWV report) | Google's official source on the SEO side | List URLs in red/orange zones to fix first |
| web-vitals (lib) | Google's open-source RUM library | Real-time field data, without CrUX's 28-day lag |
| YellowLabTools | Code-quality audit (DOM, JS, CSS, fonts) | Complement on the code side, in parallel with a perf audit |
Practical recommendations
The right setup depends less on your preferences than on your context:
| Context | Recommended setup |
|---|---|
| One-off audit | PSI first for the field-data baseline and score; WPT next (3 runs minimum, location representative of the audience) for the deep dive; YellowLabTools as a bonus for code quality |
| Continuous monitoring | PSI API daily on N URLs (alert on score or CWV drift) + WPT weekly on strategic pages (LCP, INP, filmstrip) from 2–3 locations + web-vitals RUM for real-time field data |
| CI integration | Lighthouse CI on every PR (fast, deterministic, blocking on regression) + WPT API nightly on the main branch from multiple locations |
| Before a Black Friday / traffic spike | WPT on key pages (home, PDP, cart, checkout) from multiple locations + scripting for the full purchase journey + multi-run comparison to validate stability. PSI alone won't cut it — its 28-day lag will mask any issue for up to 4 weeks after the peak |
FAQ
WebPageTest or PageSpeed Insights: which one to choose for an SEO audit?
PageSpeed Insights, first. Google's Page Experience signal relies on CrUX field data, and that's precisely what PSI displays above the Lighthouse score — at the 75th percentile over a 28-day rolling window. WebPageTest doesn't have access to this data. However, once you need to understand why an LCP is poor, WPT takes over with its waterfall and filmstrip. The practical rule: PSI to measure what Google sees, WPT to understand what to fix.
Why is my PageSpeed Insights score good while my real-world Core Web Vitals are poor?
Because they're two different measurements in the same report. The 0-100 score comes from Lighthouse in lab data: a single run, a single device (emulated Moto G4), a single network (Slow 4G), a single Google datacenter. The CrUX block aggregates your real Chrome users over 28 days at P75 — varied devices, varied connections, varied locations. Trust the field: that's what Google uses for ranking.
Is WebPageTest free?
Yes, partly. The Starter plan is free and gives access to 30 locations worldwide, filmstrip, waterfall and Core Web Vitals — with a limit of 300 tests per month. The Pro plan starts at around $18.75/month and unlocks the API, scheduled tests, advanced scripting, premium locations and queue priority. For a one-off audit, the free plan is enough. For continuous monitoring, the API is essential.
Which WebPageTest location should I choose for a French site?
Paris (EU West) if your audience is French-speaking — it's the most representative. But above all, don't test from just one location: a site that loads in 1.2 s from Paris can show 4.8 s from Mumbai or São Paulo. If you serve international users or your CDN covers multiple zones, systematically test from 2-3 contrasting locations. It's the only way to validate that an edge is working as intended.
Does PageSpeed Insights really use Lighthouse?
Yes, exactly the same engine. PSI runs Lighthouse 13 in a Google environment with a fixed mobile profile (emulated Moto G4, Slow 4G, CPU 4× throttled). You'll get results very close to lighthouse https://example.com run locally with the same settings — except for the network environment. PSI's major differentiator is the addition of the CrUX block above the Lighthouse score, which doesn't exist in the CLI.
How long does it take to get up to speed on WebPageTest?
An hour to read a basic waterfall and filmstrip, half a day to seriously leverage multi-run comparisons, scripting and the API. The learning curve is steeper than PSI (which you can use in 30 seconds), but it pays off quickly: a well-read waterfall saves hours of guesswork. The classic beginner mistake is drawing conclusions from a single run — always run at least 3 and take the median.
Can WebPageTest or PageSpeed Insights audit a page behind a login?
WebPageTest yes, via its scripting language (navigate, setCookie, setValue, clickAndWait, logData). You can navigate to the protected page and only record metrics on that page. PageSpeed Insights no: it only loads a public URL via GET, without any interaction. For authenticated pages, it's WPT or nothing — or failing that, a public copy of the page with the same assets, measured in PSI.
Does PageSpeed Insights have an API?
Yes, the PageSpeed Insights v5 API is free with a Google key. Quota: 25,000 requests per day and 400 per 100 seconds — more than enough to audit a catalog of several hundred URLs daily. This makes it the default option for large-scale monitoring, whereas the WebPageTest API (reserved for the Pro plan) is better suited to a subset of strategic pages.
Sources