Google Lighthouse: complete guide to auditing your website
Master Google Lighthouse from A to Z: installation, key metrics, score interpretation, tool limits, and real-world web performance case studies.
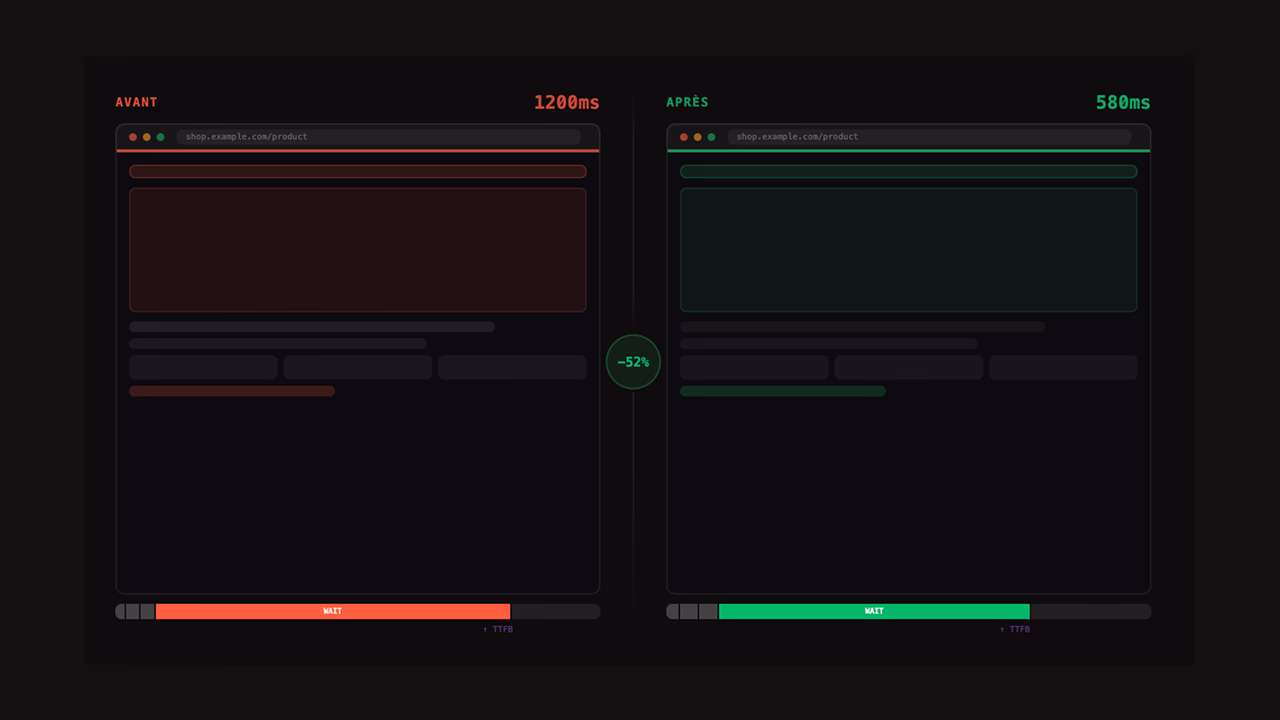
Lighthouse measures your page under simulated conditions (an emulated Moto G4 on Slow 4G), not on your real users' devices. It's lab data, and that's the first thing to internalise. Its Performance score is a composite of six weighted metrics — LCP and TBT together account for 55%. Expect ±10 to 15 points of variability between two consecutive runs on the same page: a single run tells you nothing. A red score can coexist with green Core Web Vitals — I measured a Lighthouse LCP of 14.6 s on a site whose field LCP (CrUX) sits at 1.7 s. Use it as a diagnostic starting point, never as a final verdict.
What is Google Lighthouse and what is it actually for?
Google Lighthouse is an open-source audit tool developed by Google, natively integrated into Chrome DevTools since 2017. Its principle: load a page in a controlled context, measure a series of technical indicators, and produce a structured report with scores and actionable recommendations.
Lighthouse audits up to five categories: Performance, Accessibility, SEO, Best Practices, and PWA — the last of which was removed in Lighthouse 12 (May 2024). Each produces a score from 0 to 100.
What Lighthouse does not do: measure the experience of your real users. Every Lighthouse report is lab data — synthetic data produced under standardized conditions, on a virtual machine with an emulated device and a simulated connection. This is the fundamental limitation to internalize before everything else.
Lab data vs field data: the distinction that changes everything
| Lab data (Lighthouse) | Field data (CrUX) | |
|---|---|---|
| Source | Controlled synthetic run | Real Chrome user data |
| Device | Emulated Moto G4 (CPU ×4 slower) | Your visitors' actual devices |
| Network | Simulated Slow 4G (1.6 Mbps) | Each user's real network |
| Cache | Always cold | Mix of warm/cold cache |
| Availability | Immediate, on demand | 28-day rolling minimum |
Lighthouse = diagnosis under standardized conditions. CrUX = your audience's reality.
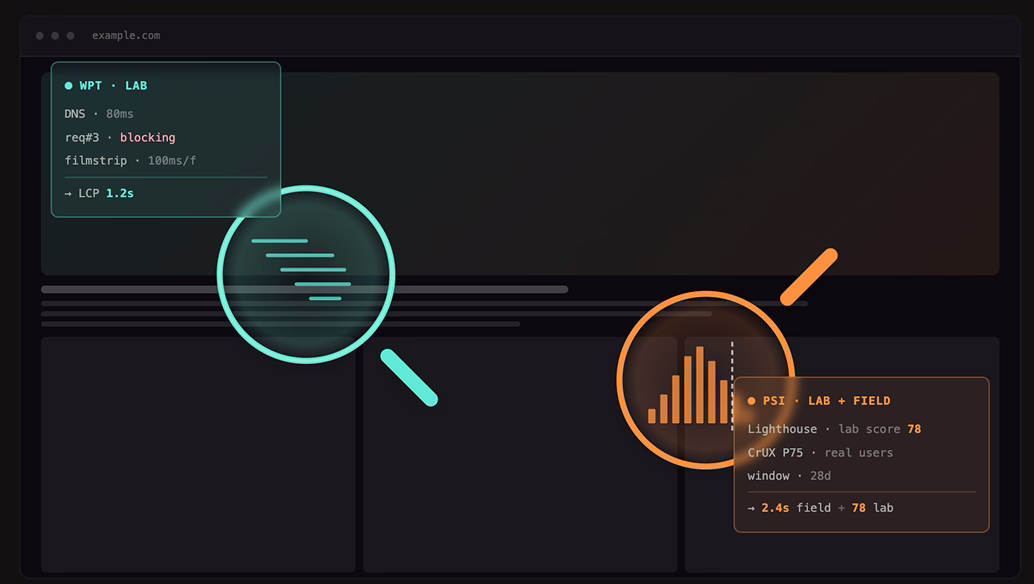
PageSpeed Insights combines both: the top section of the page shows CrUX field data (when available, which requires a minimum amount of traffic on the origin); the bottom section contains the Lighthouse lab report. Conflating these two sections accounts for the majority of misunderstandings around performance scores.
How to run a Lighthouse audit
Three methods, depending on context and the level of reproducibility required.
Chrome DevTools
- Open the target page in Chrome
F12→ Lighthouse tab- Select categories and profile (Mobile or Desktop)
- Click Analyze page load
For a reproducible run: open a private browsing window and disable all Chrome extensions. An ad blocker or password manager can alter the page's behavior and skew results.
PageSpeed Insights
PageSpeed Insights requires no installation. Enter a URL, get a Lighthouse lab report + CrUX field data in 30 seconds. It's the fastest method for a first read — and the only one that exposes both sources side by side.
Node.js CLI
For CI/CD audits or pages behind authentication:
npm install -g lighthouse

# Standard audit, mobile profile, HTML report
lighthouse https://example.com \
  --output html \
  --output-path ./report.html \
  --throttling-method=simulate \
  --emulated-form-factor=mobile

# Authenticated pages (example with session cookie)
lighthouse https://example.com/dashboard \
  --extra-headers '{"Cookie": "session=abc123"}' \
  --output json
The --budget-path option lets you fail a CI build if a performance threshold is exceeded — useful for preventing regressions on every deployment.
Variability: why two successive runs diverge
Running the same audit twice in a row can produce Performance scores that differ by 10 to 15 points. Three causes:
- CPU jitter: the virtual machine shares resources with other processes at run time
- Connection state: even with simulated throttling, resources travel across your local network to the server
- Network caching: a first run may initiate CDN connections that a second run finds already established
Practical rule: never draw conclusions from a single run. Run at least 3 consecutive runs and take the median.
Decoding the 5 score categories
Each Lighthouse audit produces up to five distinct scores. Only the Performance score is a numerical composite. The other four aggregate weighted binary audits (pass/fail).
| Category | What is measured |
|---|---|
| Performance | 6 weighted lab metrics |
| Accessibility | ~40 automated WCAG audits (Axe) |
| SEO | ~15 basic technical checks |
| Best Practices | HTTPS, console errors, deprecated APIs |
| PWA | Removed in Lighthouse 12 (May 2024) |
The Performance score in detail
The score is not a simple average. Each metric is weighted, then transformed via a logarithmic curve to compress extremes. Current weightings (Lighthouse 12):
| Metric | Weight |
|---|---|
| Largest Contentful Paint (LCP) | 25% |
| Total Blocking Time (TBT) | 30% |
| Cumulative Layout Shift (CLS) | 25% |
| First Contentful Paint (FCP) | 10% |
| Speed Index | 10% |
LCP + TBT = 55% of the score. Improving these two metrics produces the biggest shift. INP does not factor into the lab score — it is a field-only Core Web Vital that requires real interactions to be measured.
Color zones follow three thresholds: green (90–100), orange (50–89), red (0–49).
Accessibility: automated auditing doesn't see everything
An Accessibility score of 100 does not mean your site is accessible. Automated tools detect roughly 30 to 40% of WCAG issues. The rest — logical focus order, semantically empty alt text, keyboard navigation in complex components — requires manual testing with a screen reader.
SEO: an entry point, not an audit
Lighthouse's SEO score covers the fundamentals: <title> and meta description tags present, alt attributes on images, crawlable links, valid robots.txt. It says nothing about content quality, link profile, field Core Web Vitals, or crawl structure. It's a useful signal for catching glaring errors — nothing more.
The performance metrics that matter: LCP, INP, CLS, TBT, FCP, Speed Index
TTFB
LCP
CLS
Score
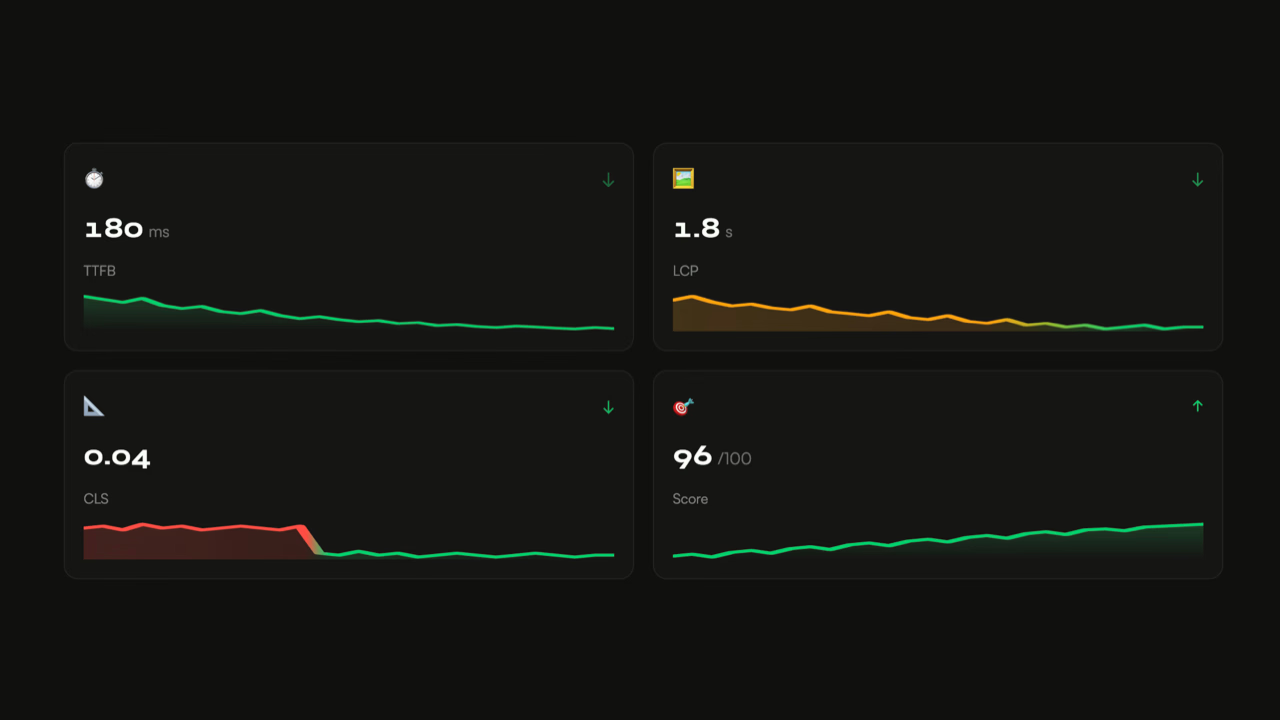
Six metrics make up the Performance score. Three are official Core Web Vitals (LCP, INP, CLS), used by Google as ranking signals.
| Metric | Good | Needs improvement | Poor | Official CWV |
|---|---|---|---|---|
| LCP | < 2.5s | 2.5 – 4s | > 4s | Yes |
| INP | < 200ms | 200 – 500ms | > 500ms | Yes |
| CLS | < 0.1 | 0.1 – 0.25 | > 0.25 | Yes |
| TBT | < 200ms | 200 – 600ms | > 600ms | No (INP proxy) |
| FCP | < 1.8s | 1.8 – 3s | > 3s | No |
| Speed Index | < 3.4s | 3.4 – 5.8s | > 5.8s | No |
For full definitions, measurement mechanisms, and fix strategies, see the Core Web Vitals measured by Lighthouse page.
LCP — Time to display of the largest visible element in the viewport: hero image, text block, video with poster. This is the metric most impacted by CDN quality, image optimization, and render-blocking resources.
INP — Responsiveness to user interactions (clicks, keystrokes). Replaced FID as a Core Web Vital in March 2024. Measurable in the field only — in lab, Lighthouse uses TBT as an approximation.
CLS — Visual stability: accumulates unexpected layout shifts. Caused by images without declared dimensions, web fonts without font-display, late DOM injections (cookie banners, third-party widgets).
TBT — Total time the main thread is blocked for more than 50ms between FCP and TTI. An imperfect proxy for INP: a page with low TBT can still have high INP if interactions trigger heavy JavaScript post-load.
Lighthouse's limits: what the score doesn't tell you
This is the section most guides skip. Understanding it is what separates amateur use of Lighthouse from professional use.
The throttling profile doesn't match your audience
By default, Lighthouse mobile simulates a Moto G4 with a CPU 4× slower than the host machine, and a Slow 4G connection (1.6 Mbps, 150ms latency). This profile represents the bottom of the global device range — it was designed to push developers to optimize for everyone.
But if your real audience uses recent devices and fast connections, this profile is systematically pessimistic. Your score will be mechanically lower than your users' actual experience — and you risk prioritizing optimizations that don't improve their real-world lives.
Runs are always cold-cache
Lighthouse loads the page with no browser cache. Your real visitors return with a partially warm cache, already-established CDN connections, and resources in memory. The first load measured by Lighthouse is the worst case — legitimate as a regression signal, but misleading as a measure of average experience.
Red lab score, green field Core Web Vitals
The gap can be spectacular.
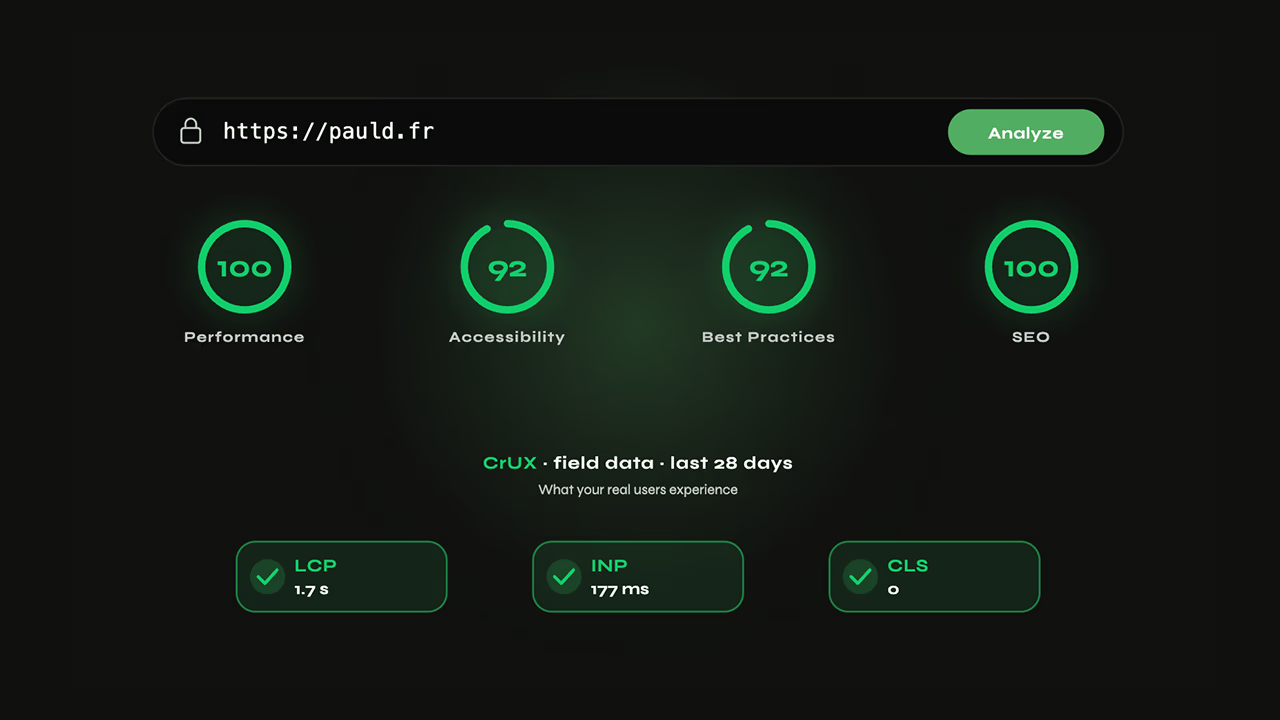
💡 PSI mobile at 51/100, and yet Core Web Vitals green on CHANEL. Open PageSpeed Insights on chanel.com in mobile: 51, orange, "needs improvement" zone. An uninformed decision-maker would read this as urgent. And yet, in CrUX field data (the "Discover what your real users are experiencing" section on the same PSI page), LCP at 1.7 s, INP at 177 ms, CLS at 0. All three Core Web Vitals are green, and chanel.com is among the best-performing sites in the luxury sector. How do you reconcile the two? PSI emulates a Moto G4 on Slow 4G for its score, which has nothing to do with a luxury brand's audience — premium devices, fibre connections. On those real devices, the edge CDN delivers everything in a few milliseconds and the optimisations in place (AVIF images, INP, code splitting) show up where it counts, in the field. The reflex to keep: a PSI score alone tells you nothing until you've looked at the CrUX data that accompanies it in the same interface. Lighthouse throttling is calibrated for the low end of the global spectrum — on a premium audience, the lab/field gap can be brutal.
The TTI case: when Lighthouse removes a metric because it doesn't work
Up through Lighthouse 9, the Performance score included Time To Interactive (TTI) — a metric meant to measure "when the page becomes interactive." It was weighted at 10% of the score. It was removed in Lighthouse 10 (February 2023) and replaced by TBT. The reason? TTI was fundamentally unstable and poorly correlated with real user experience.
The core problem: TTI waits for a 5-second window with no Long Tasks (JS tasks exceeding 50ms) and at most 2 resources downloading in parallel. In practice, a single 51ms task reset the counter — a brutal threshold effect that made the metric highly sensitive to minor third-party JavaScript variations. On real sites with analytics, widgets, or A/B tests, TTI would swing widely between consecutive runs.
As Boris Schapira summarized in his analysis of the metric: TTI doesn't measure "the time before the page becomes interactive" — it's an assurance that from a certain point onward, there's no more jank. An important distinction, and counterintuitive for anyone reading "Time To Interactive" at face value.
This is a concrete example of how Lighthouse metrics evolve over time, and how today's metrics are not definitive. TBT, which replaced TTI, is itself an imperfect proxy for field INP — it measures main thread pressure at load time, not responsiveness to real interactions.
What Lighthouse doesn't capture at all
- Real INP: interactions require a real user. TBT does not reliably predict INP once heavy JS handlers fire post-load.
- Geographic performance: a run from your local machine. WebPageTest lets you test from Paris, Mumbai, São Paulo — on sites without a properly configured CDN, gaps regularly exceed 3s on LCP.
- Multi-page performance: Lighthouse audits one URL at a time. Internal navigation (SPA transitions, prefetch, Service Worker) is not captured.
- The actual state of the page: active A/B tests, personalization, filled cart, push notifications — none of this is reproduced in a synthetic run.
When to use what
| Need | Recommended tool |
|---|---|
| Quick page diagnosis | Lighthouse (DevTools or PSI) |
| Your audience's reality | CrUX via PSI or Search Console |
| Geographic comparison | WebPageTest |
| Regression detection in CI | Lighthouse CLI + budget |
| Continuous field monitoring | CrUX API, SpeedCurve, Calibre |
To choose between PSI and WebPageTest depending on use cases, see the WebPageTest vs PageSpeed Insights comparison. To go further with a professional performance audit, Lighthouse is our starting point — never our only tool.
FAQ
My Lighthouse score is poor but my Core Web Vitals are green in Search Console — is that normal?
Yes, completely. Lighthouse measures under simulated conditions: emulated Moto G4 device, CPU 4× slower, Slow 4G network. Search Console reflects your real visitors on their actual devices and connections. If your audience uses recent devices and fast connections, the gap can be considerable — I've observed a lab LCP of 14.6s on a site whose field LCP (CrUX) sits at 1.7s. For SEO and conversion, field data is what counts.
What is the difference between Lighthouse and PageSpeed Insights?
PageSpeed Insights combines two sources: a Lighthouse report (lab data) run in real time, and CrUX field data from the Chrome UX Report. Lighthouse alone only shows lab data. PSI is therefore more complete — it lets you compare lab scores against what your real users actually experience. For pages behind authentication or to automate tests in CI/CD, the Lighthouse CLI remains more appropriate.
Is the Lighthouse score a Google ranking factor?
Not directly. The composite score (0–100) is not a ranking signal. What matters for SEO are the field Core Web Vitals (LCP, INP, CLS) measured by Google via CrUX. A Lighthouse score of 40 with green field CWV will carry more SEO weight than a score of 90 with red CWV. Lighthouse is for diagnosing — field data is for deciding.
Why is my mobile Lighthouse score much lower than desktop?
The mobile profile emulates a CPU 4× slower than your machine and a Slow 4G connection (1.6 Mbps). The desktop profile uses your actual machine with no significant network throttling. The gap can exceed 40 points on pages with heavy JavaScript or unoptimized images. This is deliberate: the mobile profile is calibrated to represent conditions at the bottom of the global device range, not your real users' conditions.
Which metrics should I prioritize to improve the Performance score?
LCP (25%) and TBT (30%) together account for 55% of the score — that's where you attack first. On LCP, target the image itself: AVIF or WebP format, fetchpriority="high", resource preload, no blocking scripts in front. On TBT, reduce blocking JavaScript through code splitting, defer on non-critical third parties, and outright removal of scripts that don't serve the first render. CLS (25%) comes next, and the fix is often quick: declare width/height on every image, aspect-ratio on media containers, and font-display: swap on web fonts.
How often should I run a Lighthouse audit?
After every significant front-end deployment (new component, framework update, addition of a third-party script). Outside of deployments, once a month is enough for moderate-traffic sites. For critical sites, automated monitoring via Lighthouse CI in a pipeline is more reliable than manual checks — it catches regressions the moment they occur.
How long does it take to run a first Lighthouse audit?
30 seconds in Chrome: F12, Lighthouse tab, Analyze button. For a reliable, reproducible audit: private browsing window, extensions disabled, 3 consecutive runs with the median taken. Allow 5 to 10 minutes for a serious first audit, including interpreting the results. The difficulty isn't running the audit — it's reading the results without taking them out of context.
Sources
- Lighthouse — official GitHub repository
- Lighthouse documentation — Chrome Developers
- PageSpeed Insights
- Web.dev — Core Web Vitals and web metrics
- Chrome UX Report (CrUX) — documentation
- Measuring Interactivity with TTI — Boris Schapira