TTFB: what is the Time to First Byte and how to optimize it?
TTFB (Time to First Byte) measures the delay between an HTTP request and the first byte of response received by the browser. Google targets < 800 ms in field data (P75). The most common causes: no page cache, cache dilution from query parameters, unoptimized database queries, no CDN. On an SFCC e-commerce site, cache key normalization reduced dilution by 80% and brought Server Response from 0.74 s to 0.63 s (−15%) in field data.
TTFB (Time to First Byte) measures the delay between an HTTP request and the first byte of response received by the browser. Google targets < 800 ms in field data (P75). The most common causes: no page cache, cache dilution from query parameters, unoptimized database queries, no CDN. On the server side, a full-page cache brings response time down to 20–50 ms; a well-configured CDN extends that gain to all regions. On an SFCC e-commerce site, cache key normalization reduced dilution by 80% and brought Server Response from 0.74 s to 0.63 s (−15%) in field data.
TTFB: definition and Google thresholds
TTFB measures the time elapsed between the moment the browser sends an HTTP request and the moment it receives the first byte of the server's response. This delay has three components: network latency (DNS + TCP + TLS round-trip), server processing time (application execution, database queries, response rendering), and any server-side queuing.
Google defines three performance levels for TTFB:
| Level | Threshold | Status |
|---|---|---|
| Good | < 800 ms | Green |
| Needs improvement | 800 ms to 1,800 ms | Orange |
| Poor | > 1,800 ms | Red |
These thresholds apply to field data at the 75th percentile (P75): 75% of real visits must come in under 800 ms to be considered good.
TTFB's place in the network waterfall
TTFB is the first phase of page loading. In the navigation waterfall, it comes before everything else: the HTML parser cannot start until the first byte has arrived, critical resources (CSS, fonts, LCP image) cannot be discovered before parsing, and LCP cannot fire until the visual element is rendered. A TTFB of 800 ms consumes 800 ms of the LCP budget before the browser has even started working. If the LCP target is 2.5 s, a TTFB of 1.2 s leaves only 1.3 s for everything else.
How to measure TTFB
Chrome DevTools (one-off diagnostic)
Open DevTools (F12), go to the Network tab, click on the first HTML request, then check the Timing panel. The "Waiting for server response" line is the pure server processing time. Use case: quickly identify whether the problem comes from the network (high DNS/TCP/TLS) or the server (high Waiting). A "Waiting" time of 900 ms with normal DNS/TCP/TLS indicates an application-level problem.
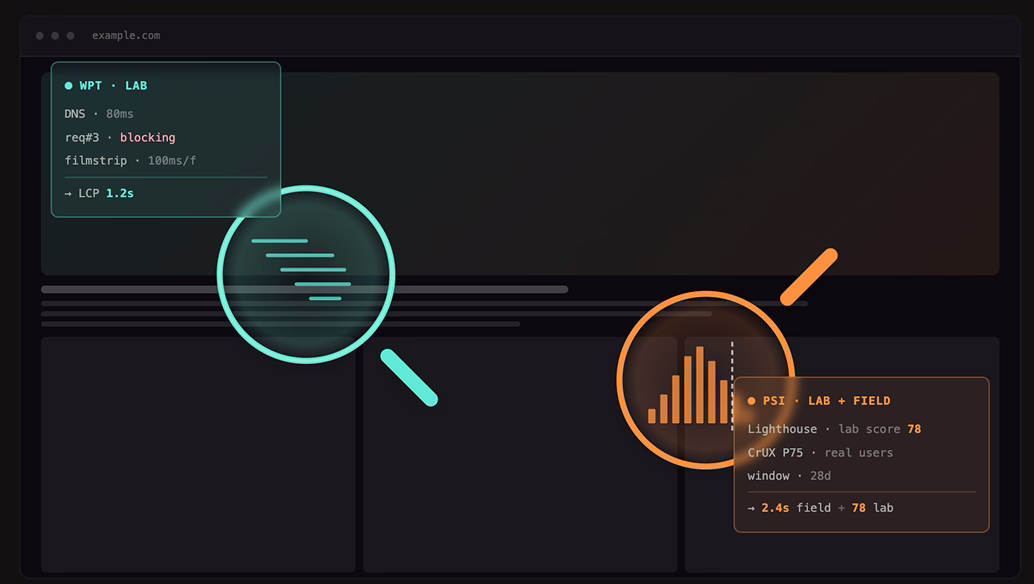
WebPageTest (controlled benchmark)
WebPageTest measures TTFB from agents located in specific cities, under simulated network conditions (Moto G4, 4G). Use case: measure from "Paris, France" on a mobile profile to benchmark a French e-commerce site, or identify a geographic gap (1.2 s from Paris, 3.8 s from Singapore) that reveals a missing or misconfigured CDN.
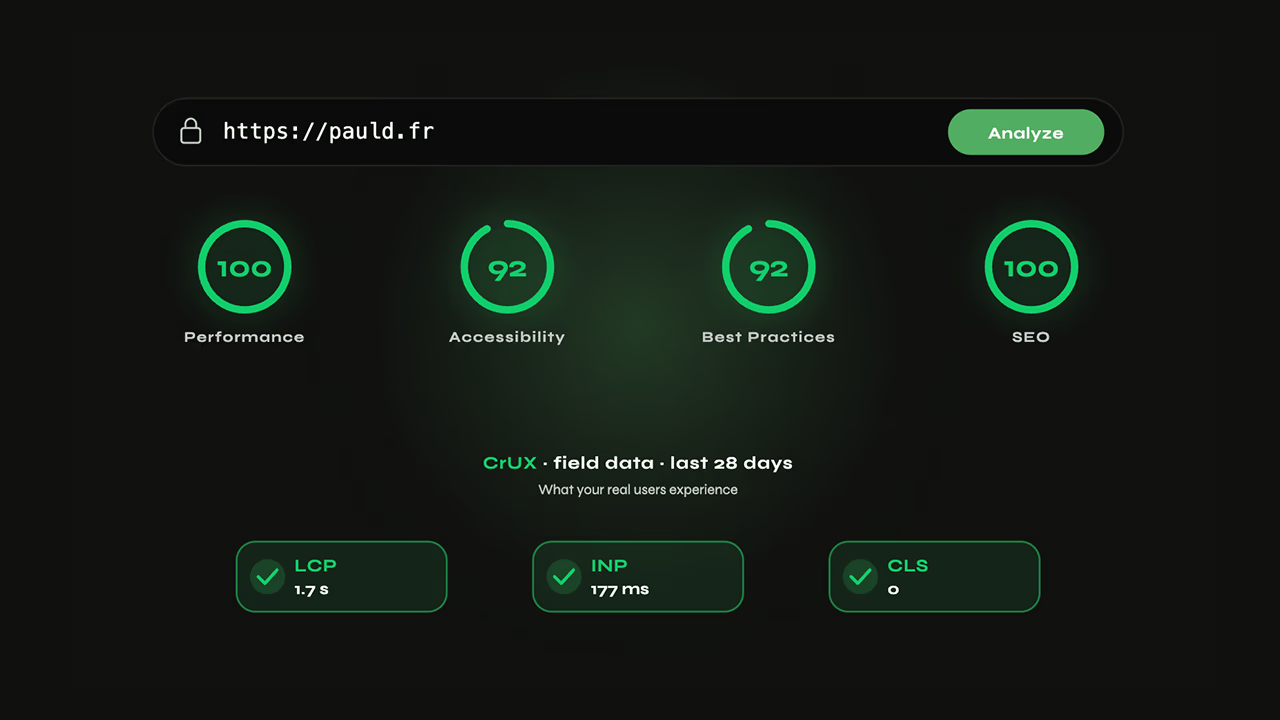
Google Search Console (P75 field data)
Search Console reports TTFB via CrUX data, aggregated over a rolling 28-day window at P75. Use case: know the real TTFB experienced by your users, across all networks and all locations. A gap between WebPageTest (good) and GSC (poor) often reveals a CDN with poor coverage or a server that degrades under the load of real traffic.
The 5 main causes of high TTFB
1. No page cache
This is the most common and most impactful cause. Without a cache, every request triggers the full application stack: routing, authentication, database queries, template rendering, response serialization. On a standard CMS or e-commerce site, this represents 300 ms to 2 s depending on complexity. With a full-page cache, the same response is served from memory in 5–50 ms.
2. Cache dilution from query parameters
A cache is in place, but the cache hit rate has collapsed. The reason: each combination of URL parameters (?color=red&size=L&sort=price_asc) generates a distinct cache key. On an e-commerce catalog with 20 filters of 5 values each, that means thousands of combinations, most of which will never be warmed. Result: the majority of requests end up as cache misses and TTFB stays high despite the existing cache.
3. Slow or unindexed database queries
A product page that loads 5 blocks of dynamic content (recommendations, stock, reviews, personalized prices, faceted navigation) can trigger 20 to 50 SQL queries. Without an appropriate index on filtered columns, each query performs a full table scan. On a catalog of 500,000 products, a non-indexed query on product_category_id can take 800 ms on its own.
4. No CDN or CDN not configured for caching
Even with a perfect server cache, network latency is irreducible. Between a server in France and a user in Singapore, the network round-trip alone adds 150–200 ms. With 3–4 round-trips for DNS + TCP + TLS + request, the mechanical TTFB reaches 600–800 ms before the server has even processed anything. A CDN with edge caching eliminates this problem by serving the response from a local node.
5. Heavy synchronous blocking computations
Some processing runs synchronously in the critical path: personalized price calculation, blocking third-party API calls (translation, personalization, real-time recommendations). A third-party API call with a 2 s timeout in the synchronous path sets the minimum TTFB to 2 s on failure. The solution is to cache these results or move them to an asynchronous flow.
Optimizing TTFB on the server side
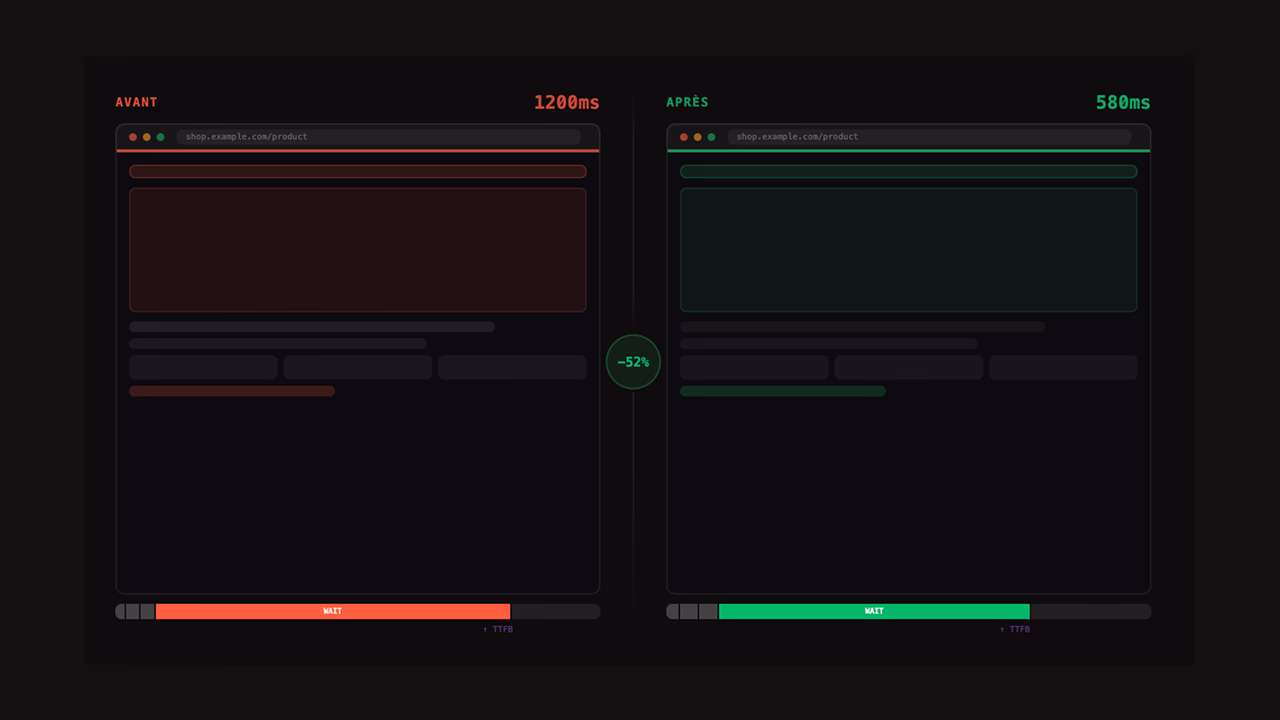
Full-page cache
A full-page cache serializes the final HTML response and stores it in memory (Redis, Memcached) or on disk. Subsequent requests to the same URL are served from cache, without touching the database or the application layer. Typical gain: from 800 ms–2 s without cache to 20–80 ms with Redis cache. On Laravel, Nginx FastCGI Cache or Varnish, the setup is immediate for public pages without personalization.
// Laravel: simple page cache with Redis
Route::get('/product/{slug}', function ($slug) {
    return Cache::remember("page:product:{$slug}", 3600, function () use ($slug) {
        $product = Product::with(['images', 'variants', 'category'])
            ->where('slug', $slug)->firstOrFail();
        return view('product', compact('product'))->render();
    });
});
Cache key normalization (anti-dilution)
The goal is to reduce the number of distinct cache keys by excluding parameters that don't change the served content. A color filter selected in JavaScript doesn't modify the raw HTML of the page; only the client-side UI selection changes.
// Build a normalized cache key: exclude non-structural parameters
function buildCacheKey(Request $request): string {
    $structuralParams = ['page', 'category', 'brand']; // influence content
    // Excluded parameters: color, size, sort, utm_source, ref...
    $params = $request->only($structuralParams);
    ksort($params); // alphabetical order to avoid duplicates
    return 'page:' . $request->path() . ':' . md5(serialize($params));
}
Database optimization
Two high-impact actions: indexing filter columns and reducing the number of queries per page.
-- Composite index for product listings filtered by category and price
CREATE INDEX idx_products_category_price
    ON products (category_id, price, status)
    WHERE status = 'active'; -- partial index: ignores inactive products
Use EXPLAIN ANALYZE (PostgreSQL) or EXPLAIN (MySQL/MariaDB) to identify full table scans before indexing. A full scan on a table of 500,000 rows consistently costs more than 200 ms.
PHP and SFCC: reducing application processing time
On native PHP, enabling OPcache eliminates script recompilation on every request (60–80% gain on PHP execution time). On SFCC, caching pipelines via Business Manager lets you control which routes use the application cache and with what TTL. Custom cartridges with synchronous API calls in the render pipeline are the number-one cause of high TTFB on SFCC.

Field insight — SFCC cache dilution from query parameters.
On an SFCC site for a luxury brand (catalog of several thousand SKUs), the application cache was in place but TTFB remained high. Analysis revealed that the color, size, and sort parameters were generating distinct cache keys for every URL combination, including combinations that had never been visited. The cache hit rate was close to zero despite an apparently configured cache. Actions taken: SFCC cache key normalization (excluding non-structural parameters from the key calculation) and implementation of an advanced application cache with TTLs tailored by page type. Result in RUM field data: cache dilution reduced by 80%, Server Response down from 0.74 s to 0.63 s (−15%). The lesson: a poorly configured cache can be almost as costly as no cache at all — and dilution auditing must come before any infrastructure decision.
Reducing TTFB with a CDN
Edge caching
A CDN with edge caching stores the HTML response as close as possible to users. When a user in Tokyo loads a page, the response is served from a Tokyo node, not from a server in Paris: network latency drops from 150–200 ms to 5–20 ms. The condition for this to work: the response must be cacheable (Cache-Control: public, max-age=3600). A response with Set-Cookie or Cache-Control: private will not be edge-cached and will always reach the origin.
# Nginx: headers to enable CDN edge caching on product pages
location ~* ^/product/ {
    add_header Cache-Control "public, max-age=3600, stale-while-revalidate=300";
    add_header Vary "Accept-Language"; # vary by language only
    proxy_hide_header Set-Cookie;      # prevent cookies from blocking CDN cache
    proxy_pass http://backend;
}
Cloudflare and Akamai: advanced configuration
Query parameter normalization can also be configured directly at the CDN level. The Cache Rules available on Cloudflare let you define precisely which parameters enter the edge cache key: ignoring sort and UI filter parameters drastically reduces the number of distinct entries, exactly like application-side normalization.
On high-traffic infrastructure, Akamai's configuration provides fine-grained control: SureRoute optimizes the network path to the origin server, Property Manager manages the edge cache key, and the Cache-Control Modification Behavior overrides origin cache headers without touching application code. A cache hit ratio below 85% on product pages is the first signal of cache dilution or a TTL that is too short.
HTTP 103 Early Hints
HTTP 103 Early Hints lets the server send Link: rel=preload directives before the complete 200 response is ready. The browser preloads critical resources (CSS, fonts, LCP image) while the server is still generating the page. On a TTFB of 600 ms, Early Hints can preload the critical CSS and brand font in parallel, reducing LCP by 200–400 ms without touching the TTFB itself. Nginx has supported HTTP 103 since version 1.25.1; Cloudflare and Akamai pass it through natively from their edges without any server configuration.
For a full analysis of TTFB in the context of a web performance audit or a global server optimization plan, these resources cover prioritization and next steps.
Sources
- Web Vitals — Time to First Byte (TTFB) — Google web.dev
- Optimize TTFB — Google web.dev
- HTTP 103 Early Hints — MDN Web Docs
- CrUX Dashboard — Chrome Developers