Core Web Vitals: LCP, INP, CLS — complete guide 2026
Comprehensive guide to Core Web Vitals — understand LCP, INP, CLS, their thresholds, how to measure and optimize them for SEO and e-commerce. 3 real-world case studies included.

Author · Updated on 06 Jul 2026
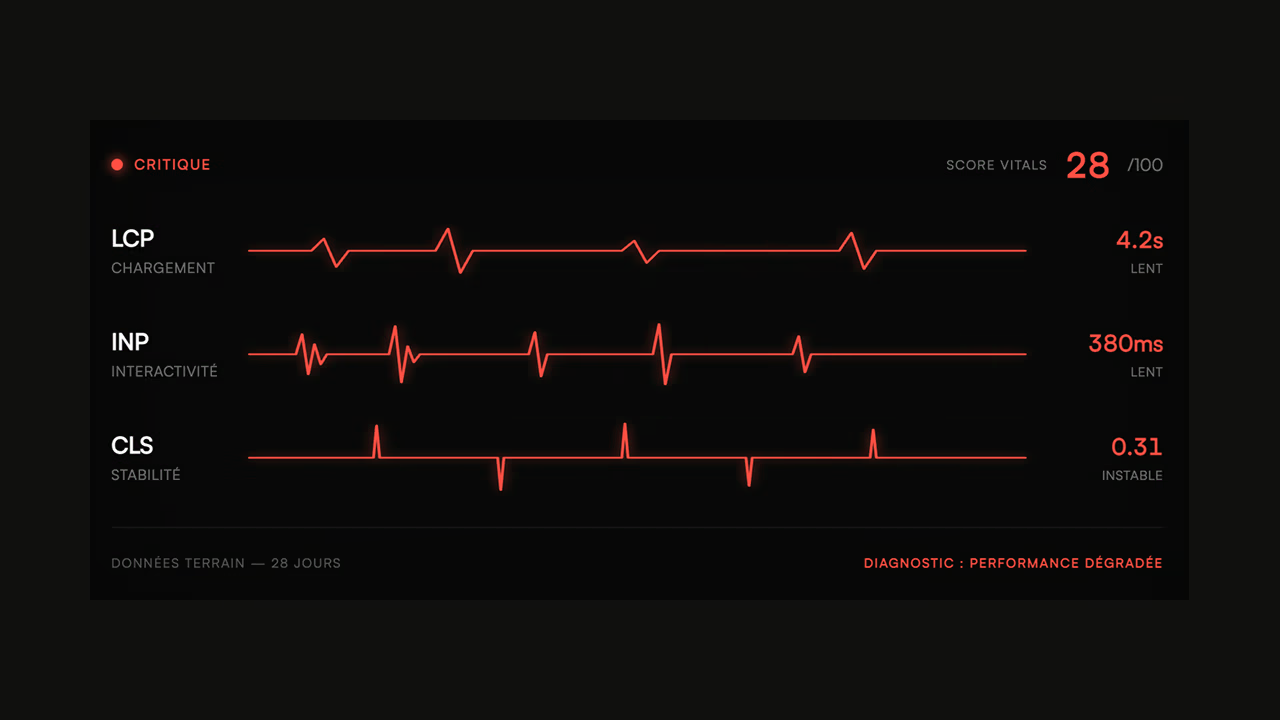
Core Web Vitals (CWV) are three official Google metrics that measure the real user experience of your pages.
- LCP (Largest Contentful Paint) — loading time of the largest visible element: good if
≤ 2.5 s - INP (Interaction to Next Paint) — responsiveness to clicks and taps: good if
≤ 200 ms - CLS (Cumulative Layout Shift) — visual stability: good if
≤ 0.1
Google evaluates these metrics at the 75th percentile of real-world loads. They influence rankings, especially as a tiebreaker between pages of equivalent quality.
Starting tool: PageSpeed Insights — free, results in 30 seconds.
What are Core Web Vitals?
Web Vitals are a set of metrics created by Google to quantify the quality of experience of a web page from the perspective of real users.
Among all web vitals, Google has selected three as official ranking signals: LCP, INP, and CLS. These three metrics cover the most critical dimensions: loading, responsiveness, and visual stability.
What sets CWV apart from traditional lab metrics is that they are based on real field data (Chrome User Experience Report or CrUX). No simulation, no ideal conditions: these are the performances measured on the actual devices of your actual visitors.
Google integrated Core Web Vitals into its ranking algorithm in 2021, and INP replaced FID in March 2024 as the official interactivity metric. In 2026, the thresholds remain unchanged.
The 3 official metrics
LCP — Largest Contentful Paint
Largest Contentful Paint measures the time it takes to render the largest visible element in the viewport when the page loads. This is typically a hero image, a main product photo, or an H1 text block.
LCP marks when the largest visible element finishes painting
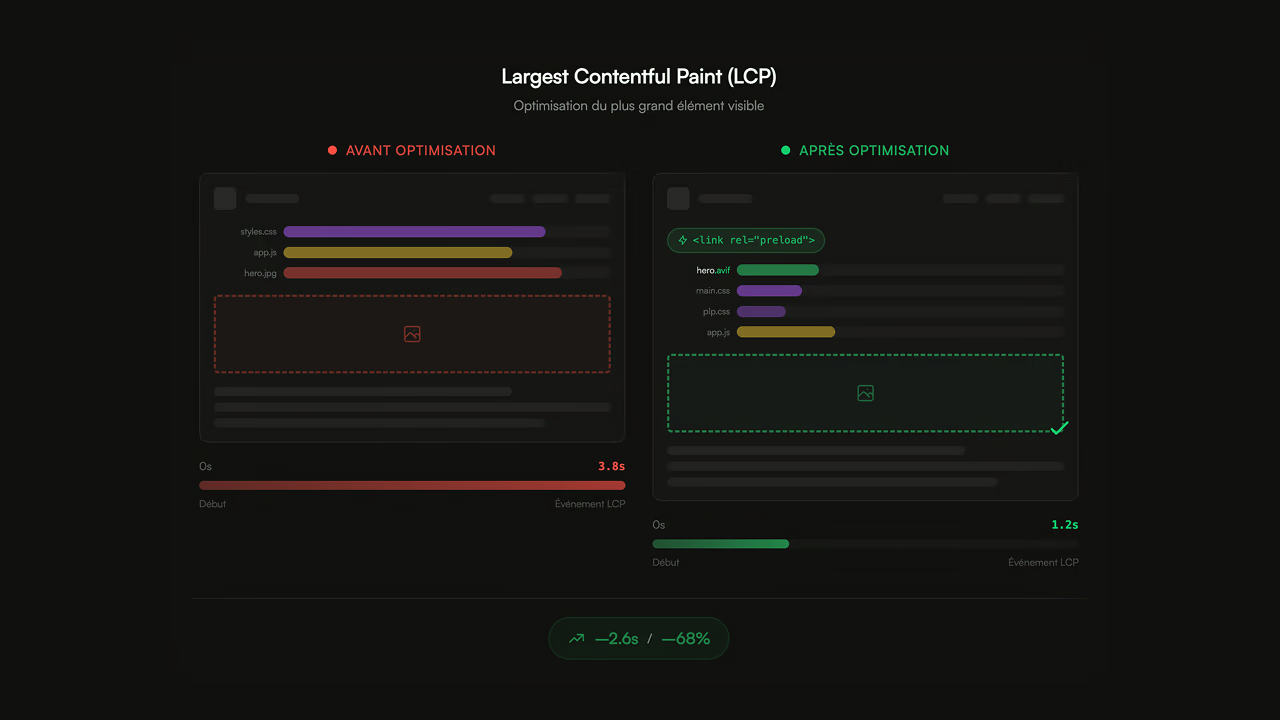
Official thresholds:
| Score | Value |
|---|---|
| ✅ Good | ≤ 2.5 s |
| ⚠️ Needs improvement | 2.5 s – 4.0 s |
| ❌ Poor | > 4.0 s |
LCP is often the hardest metric to pass on e-commerce sites, as product pages and home pages are loaded with heavy images.
Common causes of poor LCP:
- High TTFB (Time to First Byte) — slow server or no CDN
- Uncompressed image or served in JPEG/PNG format instead of WebP/AVIF
loading="lazy"attribute mistakenly applied to the main image- Hero image injected by JavaScript, without preloading
INP — Interaction to Next Paint
Interaction to Next Paint measures the delay between a user interaction (click, tap, keyboard input) and the next visual render of the page. It is the metric that best reflects perceived responsiveness.
Long JS tasks block the main thread — input waits until the road is clear
Official thresholds:
| Score | Value |
|---|---|
| ✅ Good | ≤ 200 ms |
| ⚠️ Needs improvement | 200 ms – 500 ms |
| ❌ Poor | > 500 ms |
Since March 2024, INP replaces FID on mobile and desktop. Unlike FID which only measured the first interaction, INP evaluates all interactions in the session and retains the worst.
Common causes of poor INP:
- Heavy JavaScript monopolizing the main thread
- Long tasks (> 50 ms) blocking event responses
- Third-party scripts (chat, analytics, tracking) not deferred
- Event handlers on filters, product variations, or cart that are too costly
CLS — Cumulative Layout Shift
Cumulative Layout Shift measures the visual instability of a page: every time an element moves unexpectedly during loading, the CLS score increases.
Reserve space upfront with width/height or aspect-ratio — no more dominos
Official thresholds:
| Score | Value |
|---|---|
| ✅ Good | ≤ 0.1 |
| ⚠️ Needs improvement | 0.1 – 0.25 |
| ❌ Poor | > 0.25 |
A high CLS is the "Add to cart" button shifting at the exact moment the user clicks it. Frustrating and measurable, it has a direct impact on user sentiment, and will increase dead clicks in your analytics tools.
Common causes of poor CLS:
- Images without explicit
widthorheightattributes - Web fonts replacing the fallback font after loading
- Slow A/B tests displayed without placeholders
- Cookie banners, pop-ins, or announcement bars injected above the content
- Ads or recommendation blocks without reserved space
Summary table of thresholds
| Metric | What it measures | ✅ Good | ⚠️ Needs improvement | ❌ Poor |
|---|---|---|---|---|
| LCP | Loading | ≤ 2.5 s | 2.5 – 4.0 s | > 4.0 s |
| INP | Responsiveness | ≤ 200 ms | 200 – 500 ms | > 500 ms |
| CLS | Visual stability | ≤ 0.1 | 0.1 – 0.25 | > 0.25 |
Evaluated at the 75th percentile of real-world loads, mobile and desktop.
Why Core Web Vitals impact your SEO
SEO Impact
How web performance influences search rankings
A fast TTFB allows GoogleBot to crawl more pages within its time budget
Core Web Vitals have been a Google ranking signal since 2021
Digital consulting services
Agency specializing in digital transformation and web strategy...
Your site – Web Performance Expert
Core Web Vitals audit and optimization, TTFB, LCP...
SEO and organic search expert
Boost your online visibility with my SEO solutions...
Web performance and SEO agency
Boost your website with our technical expertise...
Source: Google Search Central
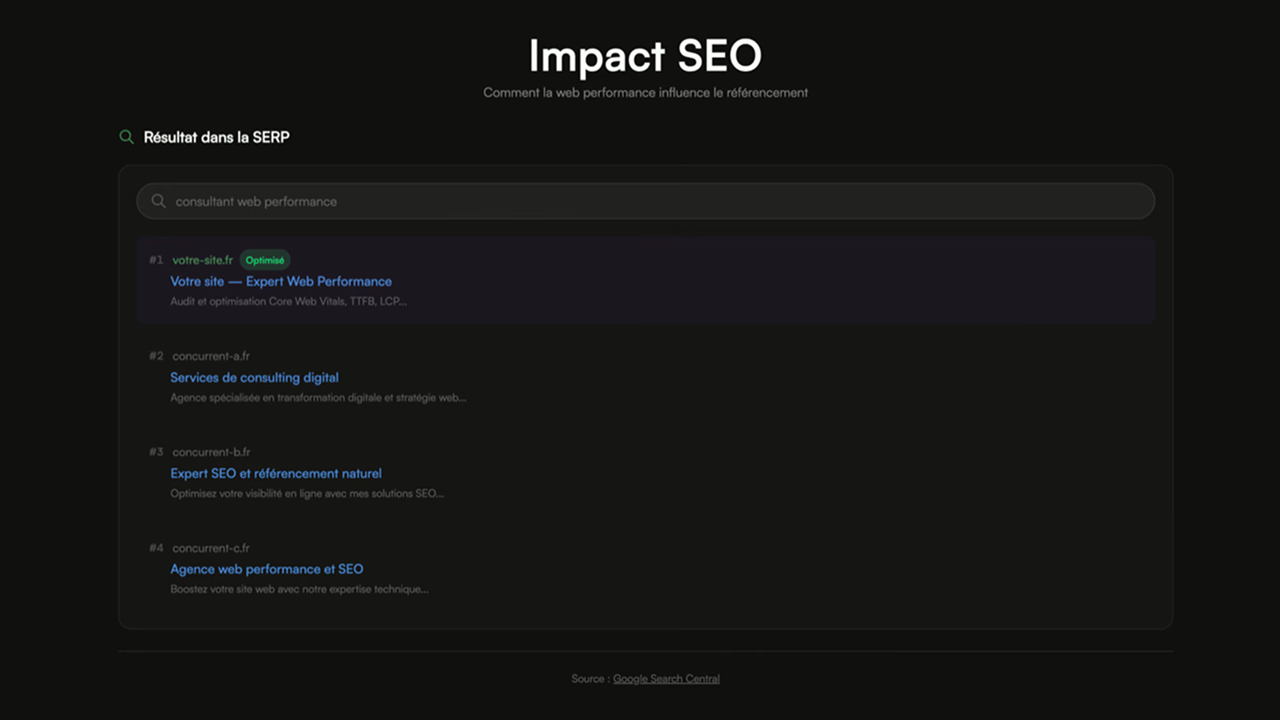
Google confirmed that CWV are a ranking signal since the Page Experience Update rollout in 2021. In 2026, they remain active and integrated into the main ranking systems.
The nuance to understand: CWV work as a tiebreaker. If two pages have similar content quality and authority, the one that passes the "good" thresholds will win. It's not a magic lever — but in competitive markets, it matters.
What the data concretely shows:
- Google evaluates CWV at the 75th percentile: if 25% of your visitors have a poor experience, your page is rated "poor"
- Mobile and desktop pages are evaluated separately in Search Console
- Moving from "poor" to "good" has more impact than optimizing a page that is already in the green
Beyond SEO, CWV have a direct impact on conversion. Google studies show that an LCP > 4 s triples the bounce rate. For an e-commerce site, every second less in load time translates to revenue.
💡 My field experience — Why a PageSpeed score of 90 is not enough. The Lighthouse score is a studio photo. CrUX data is the same person on the street. I've seen PageSpeed scores below 40 on sites that turned out to be very fast in reality. The reason: Lighthouse always simulates the same mid-range phone on a stable but slow 4G connection. CrUX aggregates real traffic, on real devices. For the majority of luxury brand sites, real users are much faster than the PageSpeed bot. My first reflex on an audit: I don't even look at the Lighthouse score — I go straight to Search Console, Core Web Vitals tab, sort by "Poor", and identify the pages causing issues.
Quantifying what your current CWV are costing your SEO and conversion rate takes 30 minutes of CrUX diagnostics. No quote before having the numbers.
How to measure your Core Web Vitals
PageSpeed Insights
TTFB
LCP
CLS
Score
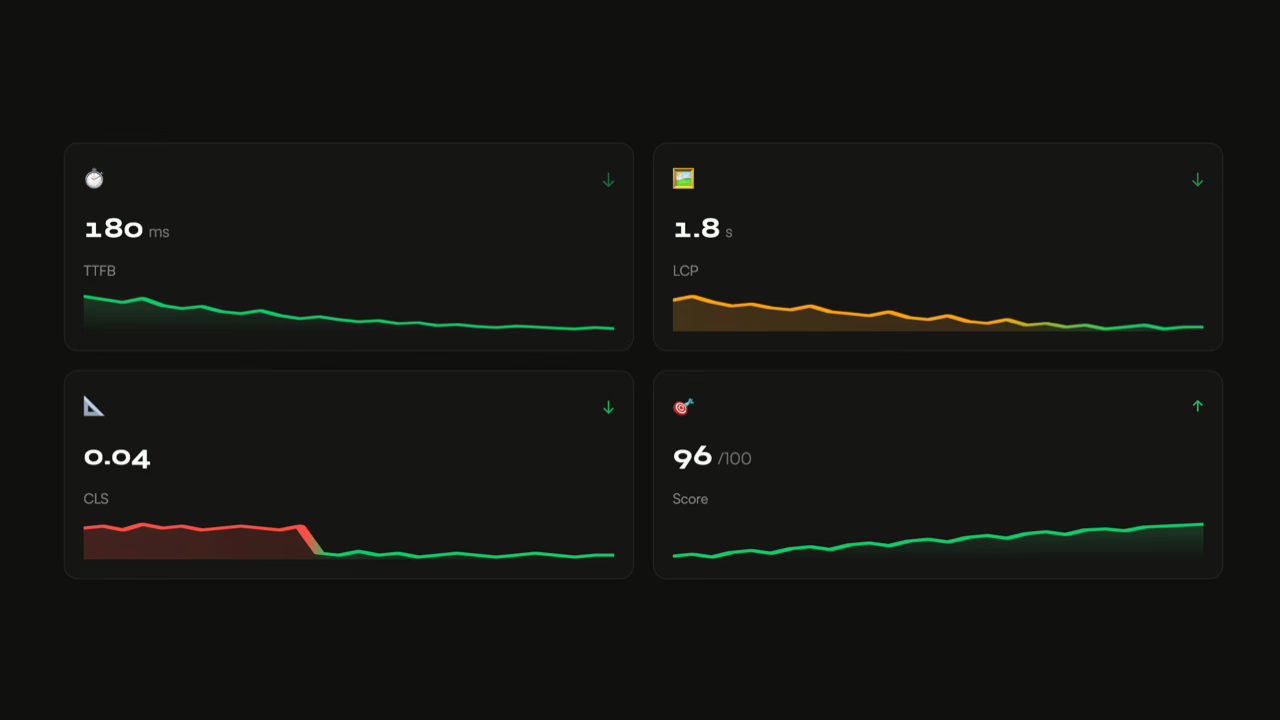
PageSpeed Insights is the essential starting point. Enter a URL, get in seconds:
- Field data (CrUX) — real LCP, INP, CLS from the last 28 days
- Lab data (Lighthouse) — detailed diagnostics and recommendations
- An overall performance score out of 100
To keep in mind: field data only appears if your URL has enough traffic in the CrUX database. For low-traffic pages, only lab data is available.
Google Search Console
The Core Web Vitals report in Google Search Console offers a sitewide view. It groups URLs by status (Good / Needs improvement / Poor) and by issue type.
Key advantages:
- Overview of all your indexed pages
- Real data over a rolling 28-day period
- Mobile / desktop separation
- Ability to click on an example URL and launch a PageSpeed Insights test directly
This is the tool to monitor continuously, not just after an optimization.
CrUX Vis
CrUX Vis (Chrome UX Report Visualizer) is the ideal tool for turning raw CrUX report data into clear, actionable charts. It allows you to analyze the history and trends of your Core Web Vitals over time.
What it offers:
- A historical visualization of the evolution of your scores (LCP, INP, CLS) over several months
- Segmented charts to understand the exact distribution of your users (Good / Needs improvement / Poor)
- Competitive analysis by allowing you to enter any domain to spy on and compare the real performance of your competitors
- A simplified comparison of performance between mobile and desktop
It is the perfect tool for measuring the long-term impact of your optimizations and conducting powerful competitive benchmarks.
Chrome DevTools
For developers, Chrome DevTools allows you to analyze CWV under lab conditions directly in the browser.
Two essential tabs:
- Performance — record a page load and visualize long tasks, INP, LCP, and CLS on the timeline
- Coverage — identify unused JavaScript and CSS that unnecessarily bloat the page
The Web Vitals Chrome extension displays LCP, INP, and CLS in real time on any page.
Third-party tools (WebPageTest, YellowLabTools)
WebPageTest is the reference tool for advanced diagnostics. It allows you to:
- Test from specific geographic locations
- Simulate different devices and network connections
- Get a detailed waterfall to identify bottlenecks
On the open-source side, YellowLabTools complements WebPageTest and provides a technical, scored view. It delivers concrete optimization reports and recommendations to improve site performance in a straightforward way, without taking into account the site's technology or any constraints specific to your platform or industry.
Both tools are particularly useful for reproducing and diagnosing issues that don't appear clearly in PageSpeed Insights.
How to optimize each metric
Optimizing LCP
Largest Contentful Paint (LCP)
Optimization of the largest visible element
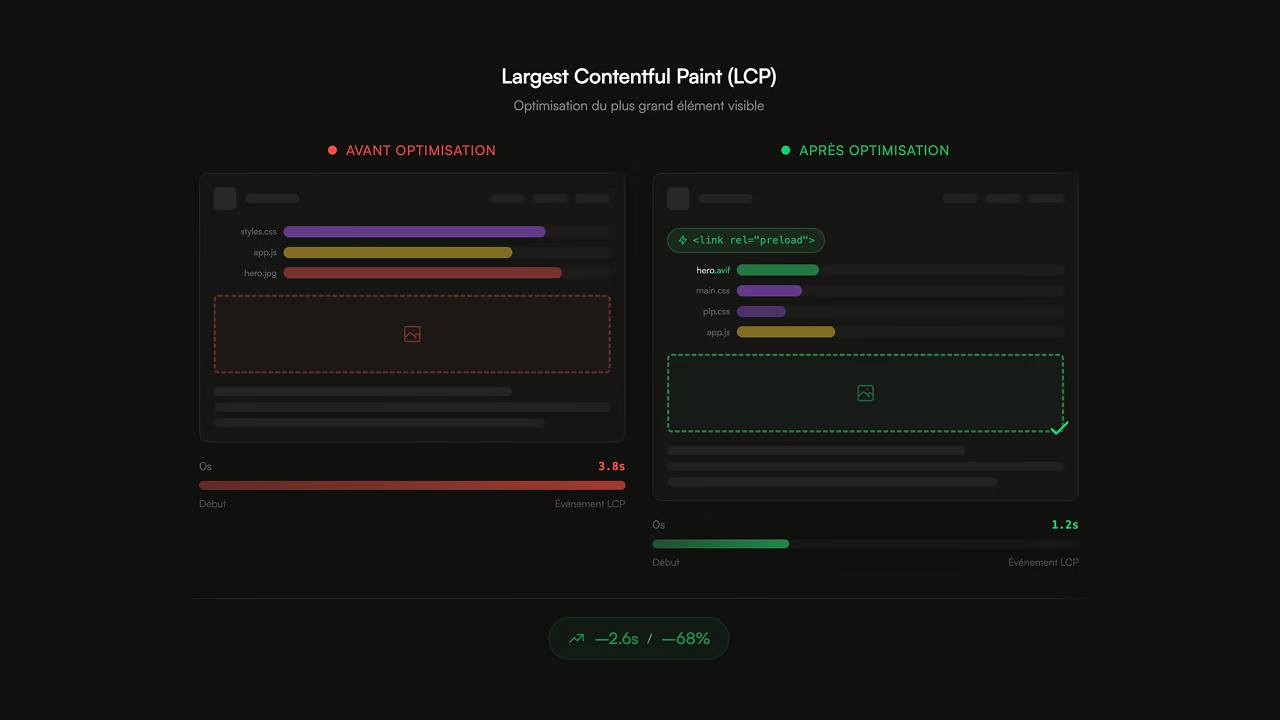
The goal: ensure the browser discovers and loads the main image as early as possible.
Priority actions:
- Preload the LCP image in the
<head>with<link rel="preload" as="image">and addfetchpriority="high"on the<img>tag — this is often the fastest win - Never lazy-load the LCP image —
loading="lazy"on the main image is one of the most common mistakes - Convert to WebP or AVIF and resize to the actual display size
- Reduce TTFB: CDN with edge delivery, server cache, performant hosting
- Avoid redirect chains and resources hosted on third-party domains without preconnect
<!-- Example of correct LCP image preloading -->
<link rel="preload" as="image" href="hero.webp" fetchpriority="high">
<img src="hero.webp" width="1200" height="600" fetchpriority="high" alt="...">
Optimizing INP
Interaction to Next Paint (INP)
User interaction responsiveness
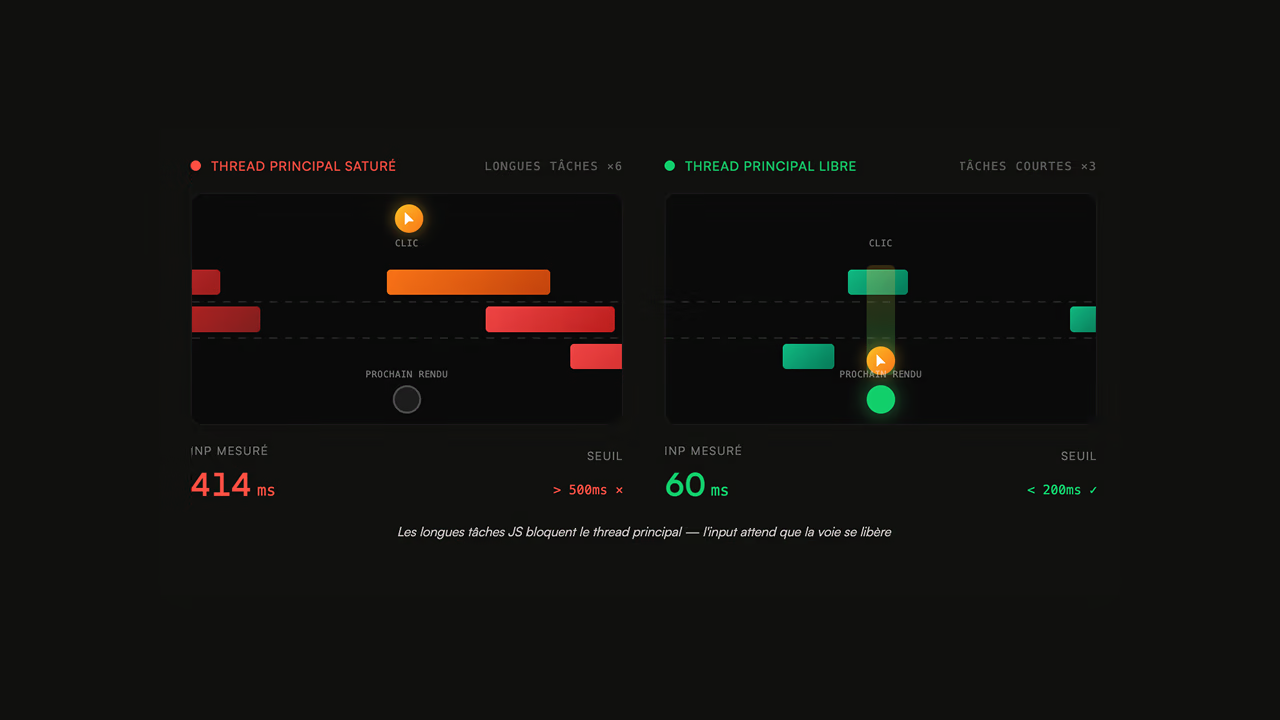
INP degrades when the main thread is saturated. The solution: lighten and defer JavaScript.
Priority actions:
- Audit with Chrome DevTools Performance to identify long tasks (> 50 ms)
- Defer non-critical scripts with
deferorasync, and third-party scripts withrequestIdleCallback() - Split large JS bundles with code splitting — only load what the page needs
- Move heavy computations off the main thread using Web Workers
- Optimize event handlers — reduce work on click, use debounce on filters and search fields
- Remove or replace unnecessary third-party scripts — every tracking, chat, or widget script has an INP cost
A poor INP on e-commerce typically manifests on: add to cart, catalog filters, product variant selectors.
Fixing CLS
Cumulative Layout Shift (CLS)
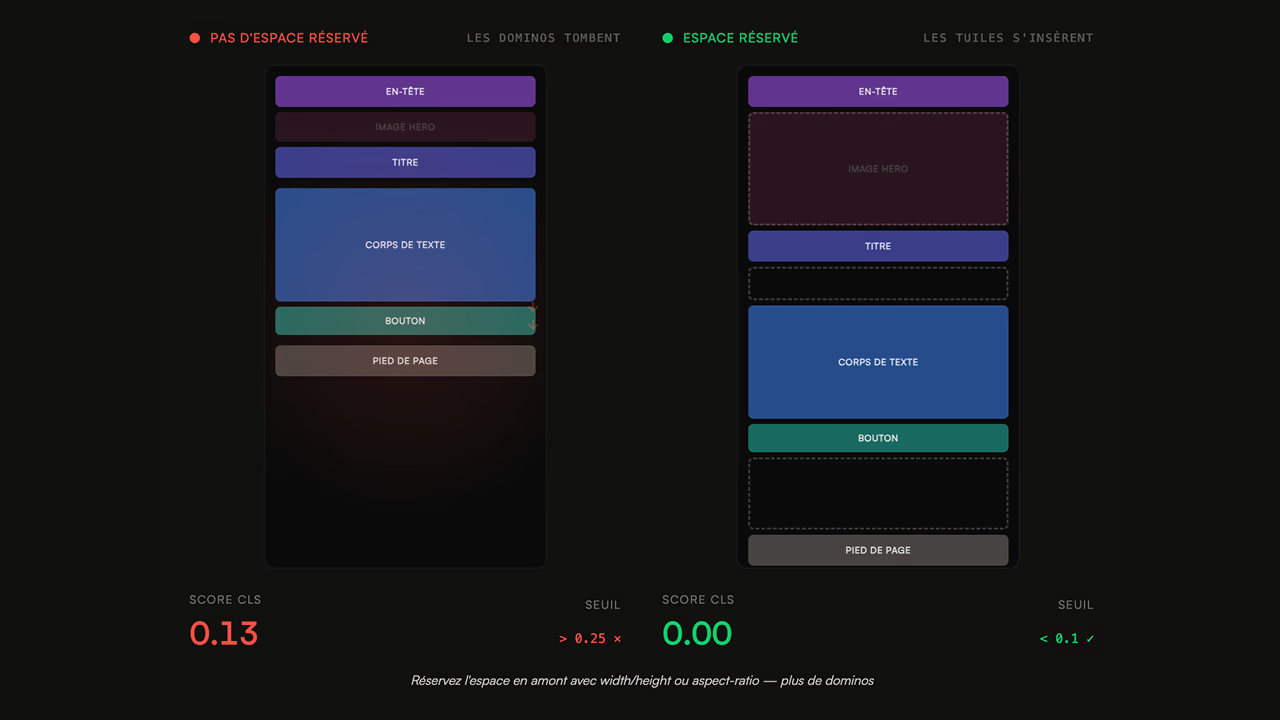
CLS is fixed by reserving space before elements load.
Priority actions:
- Always specify
widthandheighton all<img>and<video>tags - Use
aspect-ratioin CSS for responsive images whose dimensions vary - Reserve a fixed space for ads, recommendation blocks, and dynamically injected content
- Handle web fonts with
font-display: optionalorfont-display: swap+ fallback metric overrides - Never inject content above existing content without user interaction (banners, pop-ins, cookie bars)
/* Reserve space for a responsive image */
.product-image-wrapper {
  aspect-ratio: 4 / 3;
  overflow: hidden;
}
💡 My field experience — The CWV optimization with the biggest business impact. With a fashion e-commerce client (catalog of ~12,000 SKUs, ~80k monthly mobile sessions), I spent a week on a single topic: removing the JS library that calculated variable product prices client-side. It was blocking the thread for 280 ms on every size selection. After rewriting with server-side pre-calculation + HTML injection, INP dropped from 410 ms to 90 ms in field data — and the add-to-cart rate gained 8% over two months. One script removed, more impact than six months of A/B testing on the funnel. The lesson: CWV are not an isolated "tech" metric — they track the real friction in your funnel. When you optimize the right moment in the journey, the ROI is immediate.
Doing everything in-house takes time and up-to-date web performance expertise. If you want to switch to "an expert takes ownership" mode, I work directly in your codebase — no slides, just PRs.
Core Web Vitals and e-commerce: common mistakes
E-commerce sites have specific constraints that make them particularly vulnerable to poor CWV. Here are the patterns found consistently on Shopify, WooCommerce, Magento, and PrestaShop.
LCP — e-commerce pitfalls:
- Home page hero image not preloaded, often injected via a JavaScript slider
- Product photos served at original size (3–5 MB) without resizing or WebP conversion
- Heavy themes (Shopify, WooCommerce) that load dozens of scripts before the content
- High TTFB on catalog pages with dynamic filters (Magento, PrestaShop) without full-page cache
INP — e-commerce pitfalls:
- Add to cart with full page reload or overly heavy AJAX handler (WooCommerce cart fragments)
- Faceted filters (color, size, price) triggering synchronous requests and blocking the thread
- Product variant selectors (Shopify) with heavy JavaScript to calculate price and stock
- Accumulation of Shopify apps or PrestaShop/Magento modules that each inject their scripts globally
- Tracking and retargeting scripts (Meta Pixel, Google Ads, Criteo) not deferred
CLS — e-commerce pitfalls:
- Free shipping banner or announcement bar dynamically injected at the top of the page
- Cookie consent pop-in pushing content downward
- Product images without dimensions in catalog grids
- "Recommended products" or "Customers also bought" blocks appearing after initial load without reserved space
- Custom brand fonts replacing the system font late in the loading process
Priorities by platform:
| Platform | Issue #1 | Issue #2 |
|---|---|---|
| Shopify | Global JS apps → INP | Hero images → LCP |
| WooCommerce | AJAX cart fragments → INP | Images without dimensions → CLS |
| Magento | Missing page cache → LCP | Faceted filters → INP |
| PrestaShop | Non-deferred JS modules → INP | Dynamic banners → CLS |
The golden rule: audit every third-party app or module using Chrome DevTools' Coverage tab. On an average Shopify store, 40 to 60% of loaded JavaScript is unused on the current page.
💡 My field experience — The worst INP scores I've seen. The all-time record: a Shopify Plus fashion store, INP at 2,400 ms on the PDP. Root cause: 14 Shopify apps (chat, reviews, retargeting, pop-ins, upsell, currency switcher…) each adding their own listeners on critical events (click, change, submit), while 4 analytics scripts fired on every interaction. When the user clicked on a size, 6 handlers triggered in cascade on an already saturated thread. Uninstalling 9 non-critical apps + debouncing the remaining handlers + code splitting the marketing bundle brought INP down to 180 ms. My observation after 8 years: the majority of CWV problems on Shopify are not "code" problems — they are "governance" problems around what gets added to the site. Every app added by the marketing team has a performance cost, and nobody measures that cost.
Do you recognize your stack in these patterns? The audit that prioritizes the real levers (often not the ones you'd expect) takes a week and unlocks the weeks that follow.
FAQ
Are Core Web Vitals a Google ranking factor?
Yes, officially since 2021. But they work as a tiebreaker factor, not as a standalone lever. A page with excellent content and poor CWV can still rank very well — but on competitive queries, CWV can make the difference between position 3 and position 1.
What is the difference between web vitals and Core Web Vitals?
Web vitals refer to the complete set of web performance metrics defined by Google (TTFB, FCP, LCP, INP, CLS, etc.). Core Web Vitals are the three metrics officially selected as ranking signals: LCP, INP, and CLS. These are the "essential" web vitals.
My PageSpeed Insights score is good but Google Search Console shows issues. Why?
PageSpeed Insights displays lab data (simulation) and field data when available. Search Console uses only real field data (CrUX) over 28 days. A lab score of 90/100 does not guarantee good field data — real-world conditions (low-end mobile devices, slow 4G connections) are often far less favorable.
How long does it take to see the impact of an optimization in Search Console?
Search Console aggregates data over a rolling 28-day period. After an optimization, allow 4 to 6 weeks before the report fully reflects the improvement. Field data takes time to refresh.
Do Core Web Vitals apply to mobile and desktop separately?
Yes. Google evaluates CWV separately for mobile and desktop in Search Console. On the majority of e-commerce sites, mobile is more problematic — and it's the mobile version that carries the most weight in rankings since the switch to mobile-first indexing.
Which CWV metrics are most critical for an e-commerce site?
LCP is generally the first to fix — product images and sliders are frequent sources of slow LCP. INP is often the hardest to improve on platforms like Shopify or WooCommerce due to the density of third-party scripts. CLS is often the quickest to fix once images are sized and pop-ins are controlled.
Does optimizing Core Web Vitals improve conversion rates?
Yes, and it's well documented. Google has measured that an LCP > 4s triples the bounce rate. Industry studies show that a 100ms improvement in load time can increase conversion rates by 1 to 3% on e-commerce sites. CWV optimization is not just an SEO issue — it's a direct business issue.
How do I audit my Core Web Vitals before starting an optimization?
The simplest approach: a web performance audit that combines PageSpeed Insights, Search Console, Chrome DevTools and WebPageTest to precisely identify the priority levers on your stack. Without a field diagnosis, you're optimizing blind.
Official sources
- Core Web Vitals — Google Search Central
- Web Vitals — web.dev
- Optimize LCP — web.dev
- Optimize INP — web.dev
- Optimize CLS — web.dev
- Core Web Vitals report — Google Search Console
- Pagespeed Insights
- CWV threshold definitions — web.dev
Looking for web performance optimization for your site? A web performance audit dedicated to Core Web Vitals identifies the priority levers within a few days.