Web Performance Audit
The diagnosis of milliseconds that cost you (too) much
1 second too long means 10% fewer sales. Can we recover the rest?
Trusted by leading brands
8 years, 35+ brands supported on high-stakes websites.











Des résultats concrets
Une approche holistique
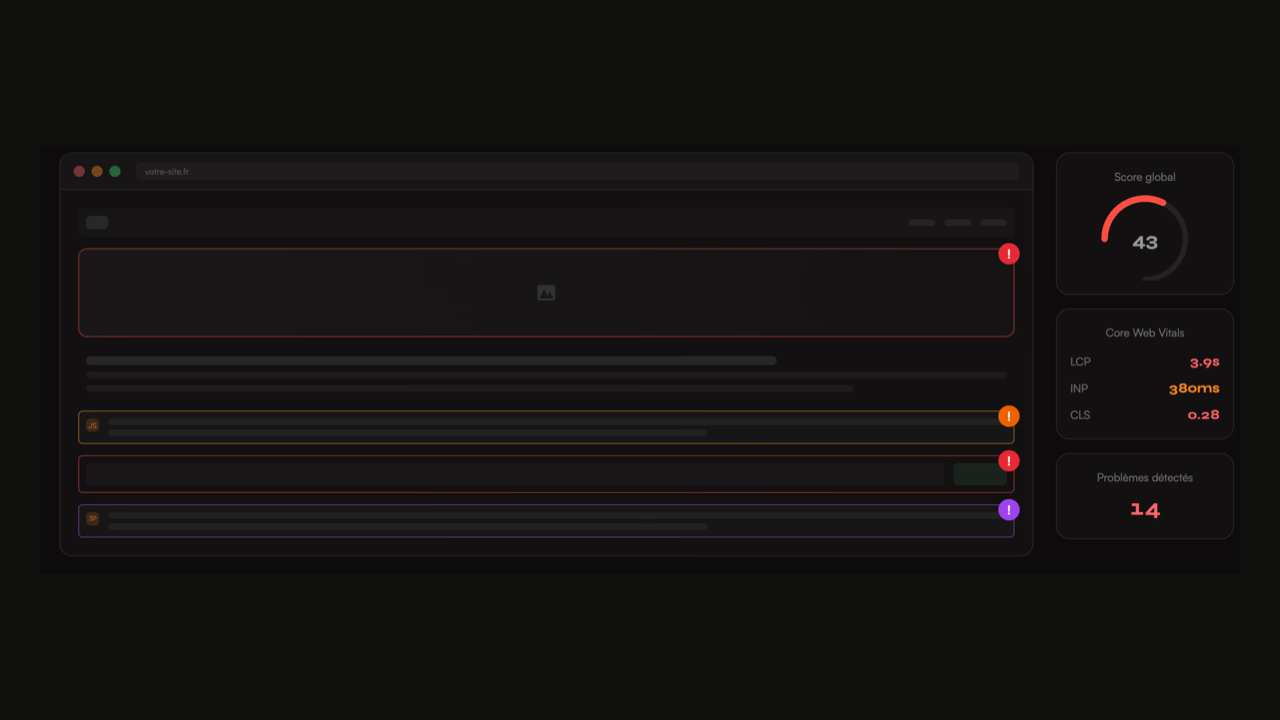
Lire un rapport PageSpeed est à la portée de tout développeur, il est plus compliqué de comprendre réellement comment améliorer la performance du site web.
? Focus sur l'expérience utilisateur
Un site rapide est un site qui convertit. La qualité de l'expérience de vos clients peut avoir une incidence sur leur confiance envers votre marque.
? Optimisation des Core Web Vitals
En améliorant la web performance, vous accéderez aux attentes de Google sur les Core Web Vitals. Une bonne perf profitera d'un boost de positonnement dans les moteurs de recherche.
? Recommandations priorisées
Pour chaque point, des conseils adaptés pondérés par la difficulté d'accomplissement et le gain espéré.
? Critical Rendering Path
Identification des ressources bloquant le rendu des pages. Optimisation de la chaîne critique de rendu par des mécanismes modernes.
? Bundles JS & CSS
Audit de l'impact des assets de votre site web. Plus le navigateur est sollicité, plus lentes seront les pages et les interactions pour vos utilisateurs.
? Scripts tiers
Les third-parties ont un impact sur le thread principal. L'objectif n'est pas de les supprimer, mais d'optimiser leur chargement et de réduire leur impact sur l'expérience utilisateur.
Des améliorations mesurables et durables
Comment se passe un audit web performance ?
Un audit performance site web se déroule en 3 étapes clés nécessaires afin de vous produire le livrable le plus complet possible.
Découverte et alignement technique
Lors de cette première visio-conférence, nous échangeons sur la technique de votre site web, vos objectifs business et les pages stratégiques à auditer en priorité.
Réalisation de l'audit webperf
À l'aide de différents outils, je réalise l'audit complet de votre site : WebPageTest, Chrome DevTools, YLT, analyse des bundles JS/CSS et des third-parties.
Présentation du livrable
Une fois l'audit terminé, je vous proposerai de nous rencontrer une seconde fois en visio-conférence pour vous présenter le rapport détaillé et répondre à toutes vos questions.
Test des recommandations
Une fois l'implémentation terminée, je vérifie la bonne implémentation des changements sur votre site.
Découverte et alignement technique
Lors de cette première visio-conférence, nous échangeons sur la technique de votre site web, vos objectifs business et les pages stratégiques à auditer en priorité.
Réalisation de l'audit webperf
À l'aide de différents outils, je réalise l'audit complet de votre site : WebPageTest, Chrome DevTools, YLT, analyse des bundles JS/CSS et des third-parties.
Présentation du livrable
Une fois l'audit terminé, je vous proposerai de nous rencontrer une seconde fois en visio-conférence pour vous présenter le rapport détaillé et répondre à toutes vos questions.
Test des recommandations
Une fois l'implémentation terminée, je vérifie la bonne implémentation des changements sur votre site.
Des optimisations sur des dizaines de technologies






















Résultats mesurables garantis
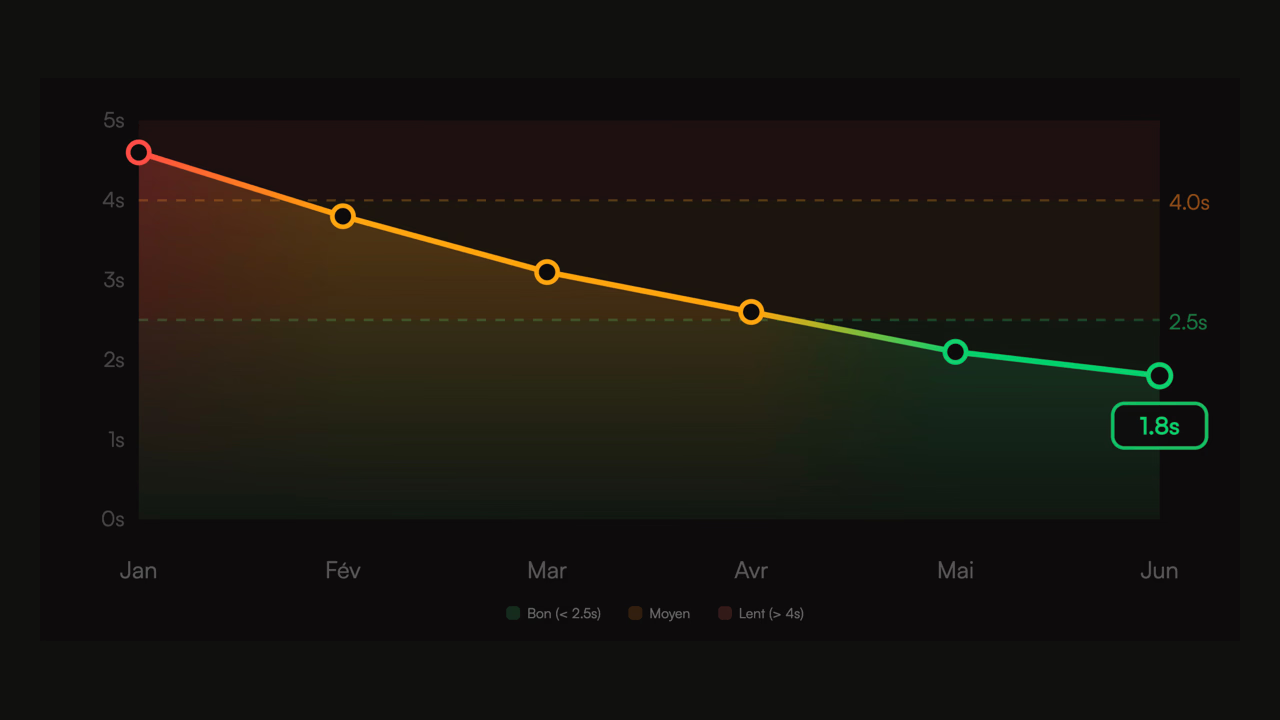
Si les recommandations appliquées conformément au rapport n'améliorent pas vos Core Web Vitals sous 30 jours, je retravaille l'audit gratuitement.
Ce qu'en disent mes clients
Excellent work.
Paul has significantly improved the site's speed and perfectly aligned it with Google's recommendations.
Professional, thorough, and efficient, I highly recommend.
Nicolas - April Moto
Digital & E-commerce Director
We are very satisfied with Paul's work. He is quick, available, and particularly effective. Since his arrival, very good results have been observed, both in terms of performance and responsiveness. A real asset for our team.
Léo - Luxury brand
E-commerce Product Owner
I don't know if we've said it enough.
But if you want to improve your loading speed,
Make Google happy and get your Core Web Vitals in the green,
Contact Paul Delcloy.
Florian Darroman - Les Makers
Co-founder
Besoin d'autre chose ?
Support for optimizing the speed and user experience of your website, e-commerce, or corporate site.
Continuous monitoring of web performance: tracking Core Web Vitals, real-time alerts, and regression detection.
Prêt à accélérer ?
Data 2023-2026
Foire aux questions
Pourquoi réaliser un audit web performance ?
Sur quelles technologies travaillez-vous ?
Les recommandations sont-elles classées ?
Why run a web performance audit?
A web performance audit is the essential starting point of any optimization work. Without a precise diagnosis, improvement efforts risk targeting the wrong levers. The audit identifies the real bottlenecks slowing your site down: render-blocking resources, unoptimized images, heavy third-party scripts, inefficient server requests.
Automated tools like PageSpeed Insights give you a score, but rarely the keys to understand and solve the problems. An expert audit goes further by analyzing the full technical context: front-end architecture, critical rendering chain, third-party impact, and real user behavior.
Core Web Vitals: the metrics that matter
Google evaluates the performance of your site through three key metrics: LCP (Largest Contentful Paint) measures how fast the main content appears, INP (Interaction to Next Paint) evaluates responsiveness to user interactions, and CLS (Cumulative Layout Shift) quantifies the visual stability of the page.
These metrics are not merely technical indicators: they directly reflect the experience of your users and influence your ranking in search results. A detailed audit of each metric makes it possible to understand exactly what degrades them and how to fix it.
From audit to actionable recommendations
Every issue identified during the audit comes with concrete recommendations, ranked by impact and implementation difficulty. This prioritization allows your teams to focus on quick wins before tackling more complex optimizations.
The deliverable includes comparative screenshots, quantified measurements, and detailed technical instructions. The goal is that each recommendation is directly actionable by your developers, with no ambiguity.
Beyond the report: full support
The audit does not stop at handing over the report. A presentation session goes through each point with your teams, answers questions, and defines the optimization roadmap together. If needed, I can also step in directly on the implementation of the recommendations, or support your developers as they carry them out.
What a web performance audit really reveals
A PageSpeed score is not an audit. It is a snapshot, generated from a California data center, on a single URL, with a simulated network profile. You get a red or green color out of it, a few generic recommendations ("Eliminate render-blocking resources"), rarely an understanding of the problem.
In eight years of web performance engagements, I have seen sites with a Lighthouse score of 45 pass Core Web Vitals in the green zone, and the opposite: lab scores of 92 that fail in the field. Chanel is a concrete case. Lighthouse score around 51, but Core Web Vitals passed with ease. The reason: the Next.js islands architecture, isolated interactive components, partial hydration. The automated tool measures the load of a heavy pre-rendered page; users benefit from a responsiveness the tool cannot simulate.
An audit does not just read the score. It cross-references three layers of data: synthetic measurements (Lighthouse, WebPageTest, YellowLabTools), field data (CrUX, internal RUM), and direct reading of the code. Without all three, you fix blind.
The difference between lab score and real-world speed
The first sorting step of an audit consists of separating what Google measures on your site from what a user actually feels. The two do not always match.
CrUX aggregates field data on Chrome visitors over the last 28 days. It is the foundation Google uses to rank your site on the Page Experience layer. A field TTFB of 900 ms reveals an infrastructure problem that Lighthouse, running on a controlled simulation, may downplay to 300 ms. Conversely, an INP of 45 ms in the lab can mask a JavaScript handler at 320 ms on real 4G mobile, exceeding the red-zone threshold.
A usable audit identifies these divergences. On a recent e-commerce project, I saw a field LCP of 3.8 s while Lighthouse reported 2.1 s. The cause: the mobile hero was loading a 340 KB AVIF image on a median 6 Mbit/s connection, while Lighthouse simulated a more favorable one. Solving the problem meant a conditional srcset, not another generic image optimization.
The pyramid of sources of truth
From least reliable to most decisive:
- PageSpeed summary score: rough indicator, only consult as priority 3.
- Local Lighthouse: reproducible, but dependent on the machine's profile.
- Multi-location WebPageTest: the expected level of rigor in a serious audit.
- CrUX: the truth in Google's eyes.
- Internal RUM: the truth in your users' eyes.
The diagnoses no tool can make for me
Automated recommendations hit a wall on three recurring classes of problems: architectural decisions, business-side configuration mistakes, unexpected interactions between third-party components. No tool names them correctly. A serious audit actively looks for them.

The browser cache that no longer exists.
French e-commerce site, 60,000 sessions/month, field LCP at 4.2 s despite a properly configured CDN. The PageSpeed score pointed to "cache duration too short", nothing more. The audit revealed the root cause: shipping fees were displayed from the first page, calculated from the postal code entered in a pop-up. The postal code was used as a cache segment. Every combination of postal code plus product category generated a distinct cache entry. Result: the browser cache of the returning visitor was almost useless — the HTML was re-downloaded on every visit. Fix: switch shipping calculation to a post-load AJAX call, global HTML cache. Field LCP down to 1.6 s in three weeks, mobile bounce rate down 14%.
This is the type of diagnosis you pay an audit for. Tools see a symptom (short cache). A consultant traces it back to the product decision that caused it and proposes the technical alternative.
Another often invisible category: modules and plugins that behave like stowaways. On an institutional Drupal platform, I audited six modules that each loaded a JS bundle, a CSS sheet, and ran several thousand lines of SQL on every page, when their data was only used by a form present on a single page. Median TTFB at 1.3 s, with 450 ms directly attributable to this excess. Conditional loading brought the TTFB down to 850 ms without touching the CMS core. This kind of analysis requires going down into the theme and module code, not reading a report.
Prioritizing fixes: the impact / effort matrix
An audit that delivers 40 recommendations without prioritization is a useless audit. I attach a double rating to each identified point: estimated business impact on the affected Core Web Vitals, implementation effort in developer-days. This matrix does the sorting.
In a recent presentation session, out of 32 recommendations identified, 6 concentrated 78% of the potential LCP gain, for a combined 4 days of development. The rest, spread across smaller fixes, took 21 combined days for the remaining 22% of the gain. The DSI's decision was clear: ship the 6 in an immediate sprint, budget the rest across the following quarters. Without the matrix, they would have started with the first recommendation in the report, often the least cost-effective.
The matrix also helps arbitrate trade-offs. Switching web fonts to font-display: optional saves 200 ms of LCP but may suppress the display of the brand font on slow uncached connections. That is not a technical decision, it is a trade-off between brand guidelines and speed. The audit surfaces the trade-off; product leadership decides.
When an audit reshapes a product decision
The outcome of an audit can go beyond the initial scope and challenge a direction. I have lived through that moment several times. Here is one.
April Moto: from perceived slowness to a targeted fix.
[WordPress](https://pauld.fr/en/expertises/wordpress) site for motorcycle insurance brokerage, traffic sensitive to SEA campaigns. Field LCP at 3.2 s on mobile, INP in the orange zone. The initial request was for a full theme redesign, with a significant estimated budget. The audit showed that 68% of the render time came from three plugins (forms, consent popup, chat) and an overloaded hero slider. Three weeks of targeted work on these four components, without a redesign: LCP dropped to 1.3 s, INP in the green, measured conversion gain of +9% on quotes. The redesign was pushed back to the following year, this time framed by field data rather than a "the site looks dated" gut feeling.
A web performance audit that concludes "you do not need to rebuild, fix this" is sometimes the most profitable deliverable. Conversely, an audit can also reveal that no marginal optimization will make up for an initial architecture choice, and that a partial redesign of the critical path is the right investment. In both cases, the decision is made on measured data, not on impressions.
What an audit does not replace
The audit is a starting point, not an endpoint. Three honest limitations to know before commissioning the work.
An audit does not replace a phase of web performance optimization. The report identifies and prioritizes, but implementing the recommendations requires either trained in-house teams or ongoing support. Without that hand-off, an expensive audit ends up on a shelf. I systematically offer an implementation option for clients without immediate internal capacity.
An audit also does not replace a continuous web performance monitoring setup. Core Web Vitals silently degrade with every deployment, every marketing tag integration, every plugin update. A one-off audit without subsequent monitoring is a snapshot of a system that keeps moving. Three months later, the situation has evolved. Monitoring field metrics, with regression alerts, extends the benefit of the audit over time.
Finally, an audit does not substitute for a performance culture shared by the product teams. The mistakes that sink Core Web Vitals are often introduced by developers or marketers who do not measure the impact of their choices. An audit that delivers its report and steps away leaves the ground fertile for regressions. On longer engagements, I systematically include an awareness session for the teams involved: what INP is, why a decorative carousel tanks CLS, how to measure before integrating a new third-party script.
Frequently asked questions about the web performance audit
How long does a web performance audit take?
Five business days on average, from the first technical exchange to the debrief. The detailed report takes two to three days of actual analysis, plus a one-hour video debrief session. On complex projects (multi-domain, SPA applications with many critical paths), the timeline can reach eight days.
What does an audit concretely cover?
The analysis covers the full rendering chain: server TTFB, render-blocking resources, LCP image, JavaScript and CSS bundles, third-party scripts, long tasks on the main thread, visual stability. It cross-references Lighthouse, WebPageTest, Chrome DevTools, YellowLabTools and CrUX data. The report includes comparative screenshots, expected before/after measurements, and recommendations ranked by impact.
Is PageSpeed Insights enough for an audit?
No. PageSpeed Insights gives a useful entry point but is not sufficient. It runs on a fixed simulation, only tests one URL, does not go down into the code, does not understand the product decisions that caused a problem. A green PSI score can hide a degraded field TTFB; a red score can mask excellent real Core Web Vitals. The audit checks the lab / field gap and goes after the root causes.
Can I run my own audit with Lighthouse?
You can run Lighthouse locally and read the recommendations. You will not have the prioritization matrix, nor the code reading, nor the cross-view of your competitors' Core Web Vitals, nor the experience of technical decisions that worked elsewhere. On a site with commercial stakes, the difference between "I have recommendations" and "I know which three fixes will move the needle" is what makes the value of an external audit.
What happens if the recommendations do not improve the Core Web Vitals?
If the fixes applied in line with the report do not improve the Core Web Vitals within 30 days, I rework the audit at no extra cost. That commitment exists because I deliver testable recommendations, with a quantified expected gain for each point.
When to trigger a web performance audit
Some signals do not lie and justify an audit without waiting for the next redesign.
A drop in Core Web Vitals in Search Console, not explained by an identified release, is a strong signal. I have seen sites tip into the red zone in three weeks because of a single marketing tag added by an outside agency without going through the technical team. Without an audit, the cause stays invisible for months.
A rising mobile bounce rate while traffic remains stable, a declining average session time, an average basket that drops on mobile faster than on desktop: three business indicators that often point toward performance without saying so. Mobile conversion reacts quickly to a degraded LCP, and the signal shows up in commercial dashboards before it appears clearly in Google Analytics.
Finally, a major infrastructure change — hosting migration, major CMS version update, theme redesign, CDN addition — calls for a control audit two to three weeks after going live. Long enough for CrUX data to stabilize, then a check that the initial promise of the change has translated into a field gain. On three recent projects, the migration promised as "faster" by the previous vendor had actually degraded TTFB from 200 to 400 ms. A short audit, focused on the before / after gap, made it possible to renegotiate the contract.