Web Performance Monitoring
Keep Control Over Your Site's Performance
Detect regressions before your users do with continuous monitoring of your Core Web Vitals and performance metrics.
Overall score
Google PageSpeed Insights
Poor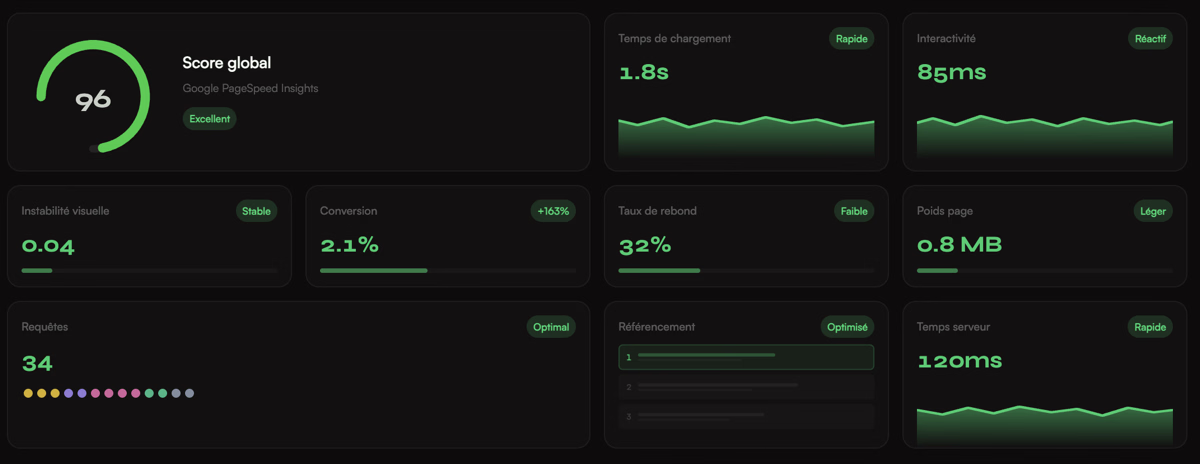
Trusted by leading brands
8 years, 35+ brands supported on high-stakes websites.











Pourquoi monitorer la performance
Un monitoring taillé pour la performance
Chaque déploiement, chaque ajout de contenu ou de script peut dégrader votre site. Le monitoring transforme la performance en un indicateur fiable et actionnable.
? Suivi des Core Web Vitals
LCP, INP, CLS : vos métriques clés sont suivies en continu avec des données terrain (RUM) et synthétiques pour une vision complète.
? Alertes de régression
Recevez une alerte dès qu'une métrique dépasse un seuil critique. Détectez les régressions en quelques minutes, pas en quelques jours.
? Tableaux de bord personnalisés
Des dashboards clairs pour vos équipes techniques et décisionnelles : évolution des métriques, corrélation performance/conversion, budgets de performance.
? Intégration CI/CD
Le monitoring s'intègre à votre pipeline de déploiement pour bloquer automatiquement les mises en production qui dégradent la performance.
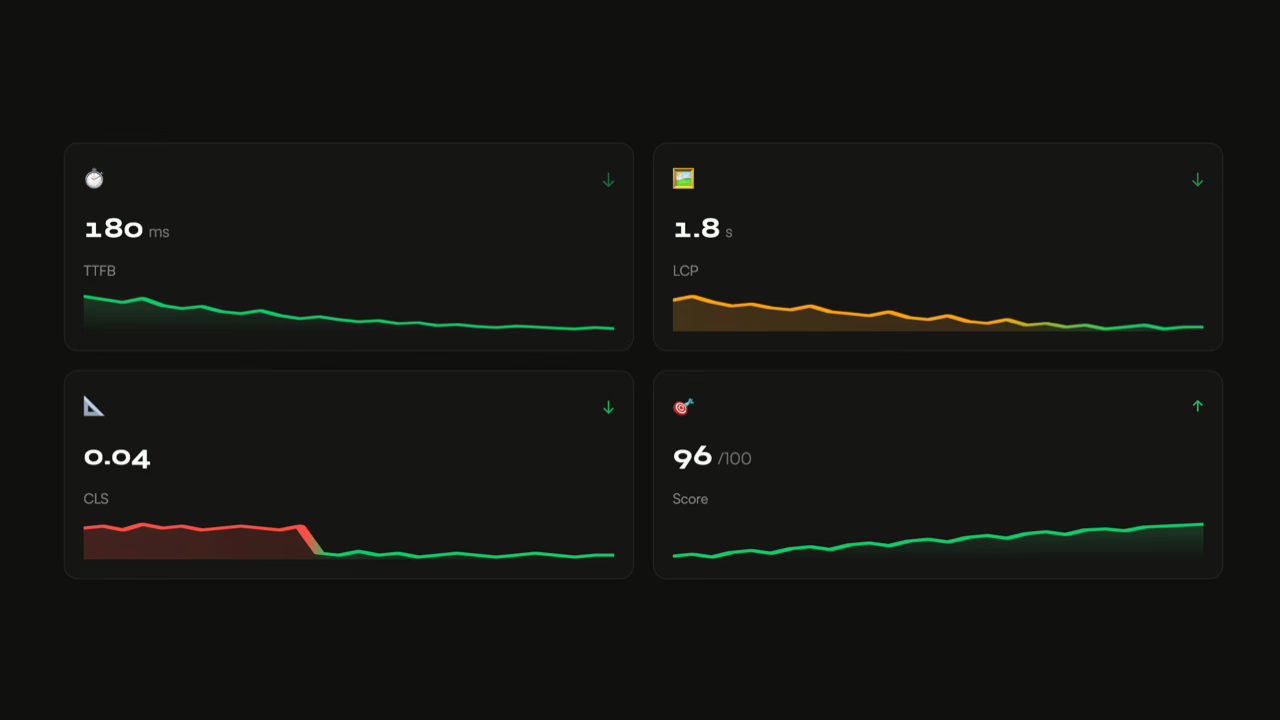
Vos métriques en temps réel
TTFB
LCP
CLS
Score
Comment se met en place le monitoring ?
Un dispositif opérationnel en quelques jours
Configuration des sondes
Mise en place du monitoring synthétique et du Real User Monitoring (RUM) sur vos pages stratégiques.
Alertes et seuils
Définition des seuils d'alerte par métrique et par page, avec notification par e-mail, Slack ou webhook.
Dashboards et reporting
Création de tableaux de bord adaptés à vos équipes : technique, marketing et direction.
Configuration des sondes
Mise en place du monitoring synthétique et du Real User Monitoring (RUM) sur vos pages stratégiques.
Alertes et seuils
Définition des seuils d'alerte par métrique et par page, avec notification par e-mail, Slack ou webhook.
Dashboards et reporting
Création de tableaux de bord adaptés à vos équipes : technique, marketing et direction.
Compatible avec toutes les technologies
Le monitoring s'adapte à votre stack : WordPress, Shopify, React, Next.js, Laravel ou toute autre technologie.






















Détection garantie sous 24h
Toute régression significative de vos Core Web Vitals est détectée et signalée sous 24 heures maximum. Si une dégradation passe inaperçue, j'interviens sans frais supplémentaires.
Ce qu'en disent mes clients
Excellent work.
Paul has significantly improved the site's speed and perfectly aligned it with Google's recommendations.
Professional, thorough, and efficient, I highly recommend.
Nicolas - April Moto
Digital & E-commerce Director
We are very satisfied with Paul's work. He is quick, available, and particularly effective. Since his arrival, very good results have been observed, both in terms of performance and responsiveness. A real asset for our team.
Léo - Luxury brand
E-commerce Product Owner
I don't know if we've said it enough.
But if you want to improve your loading speed,
Make Google happy and get your Core Web Vitals in the green,
Contact Paul Delcloy.
Florian Darroman - Les Makers
Co-founder
Services complémentaires
Complete audit of your site's web performance: identification of bottlenecks, analysis of Core Web Vitals, and prioritized recommendations.
Support for optimizing the speed and user experience of your website, e-commerce, or corporate site.
Questions fréquentes
Quelle est la différence entre monitoring synthétique et RUM ?
Quelles métriques sont suivies ?
Faut-il avoir fait un audit avant de mettre en place le monitoring ?
Le monitoring ralentit-il mon site ?
Prêt à surveiller votre performance ?
Data 2023-2026
Why web performance monitoring is indispensable
A website is never performant once and for all. Every new deploy, every content addition, every plugin update or third-party script integration can silently degrade your site's speed. Without monitoring, these regressions go unnoticed for days or even weeks, until the impact hits your conversions and your SEO.
Web performance monitoring turns an invisible indicator into actionable data. It gives you permanent visibility into your site's health and lets you intervene before degradations reach your users.
Core Web Vitals: the metrics that matter
Google has made Core Web Vitals an official ranking factor. LCP (Largest Contentful Paint) measures display speed, INP (Interaction to Next Paint) measures interaction responsiveness, and CLS (Cumulative Layout Shift) measures visual stability. These three metrics directly reflect what your visitors experience.
Continuous tracking of these indicators, combined with field data (Real User Monitoring), lets me separate normal variation from actual regressions and correlate performance with your business KPIs: conversion rate, bounce rate, average cart value.
Detecting and preventing regressions
Most performance regressions are not isolated incidents but gradual degradations. A marketing script added here, an unoptimized image there, a third-party widget updated: these small changes pile up and eventually weigh on the user experience. A properly calibrated alerting system catches these drifts as soon as they appear.
Integrating monitoring into your CI/CD pipeline goes one step further: every deploy is automatically evaluated on performance, and releases that push metrics beyond defined thresholds can be blocked before they reach your users.
An investment that pays off over time
The cost of an undetected regression is much higher than the cost of monitoring. One extra second of LCP can drop your conversion rate by 7%. On a high-traffic site, that's tens of thousands of euros in lost revenue per month. Monitoring protects the gains from optimization work and keeps performance stable over time.
Why web performance monitoring changes the nature of the investment
An audit or a one-off web performance optimization produces a point-in-time gain. Monitoring turns that gain into a durable asset. The difference is structural. Without surveillance, Core Web Vitals follow a natural slope toward degradation. Every deploy, every new marketing tag, every plugin update adds a few milliseconds that stack up silently. Three months after a successful optimization, half the gain has melted away if nothing is monitored.
Monitoring is not just another technical service. It's the foundation that makes everything else pay off. A site that monitors its TTFB, INP and CLS in the field continuously can detect a regression within 24 hours of the deploy that caused it. The same site without monitoring learns about it two months later through an unexplained drop in conversion.
The distinction with synthetic tools (PageSpeed Insights, Lighthouse CI) matters. Web performance monitoring relies on field data (CrUX, in-house RUM, aggregates from distributed probes). It measures what your real users live through, not what a machine in California simulates.
What a well-configured monitoring setup reveals
A monitoring setup that only tracks site-wide Core Web Vitals is a start, not a proper service. The value of a serious setup lies in the granularity it enables.
On an e-commerce platform, I systematically monitor four distinct segmentations. By page type: home, category, product page, checkout funnel. Each type has its own critical metrics and its own alert threshold. By device: mobile vs desktop, with particular attention to mobile, which concentrates 65 to 80% of e-commerce traffic and weighs more heavily in the Search Console report. By geography: Paris vs the rest of France vs European countries vs long-haul export, each zone has its own network profile and its own TTFB. By site version: stable production vs canary test branches, to confirm a deploy doesn't degrade anything before switching 100% of traffic.
This granularity changes the nature of surveillance. A global LCP at 2.4 s can hide a mobile product-page LCP in Paris at 3.8 s that costs sales. Without segmentation, the aggregate is reassuring and the problem persists. With segmentation, the alert fires as soon as a segment slips, and the team acts before traffic suffers.
Catching a regression before your users do

A marketing tag that broke INP in 48 hours.
French media site, 220,000 sessions/day, RUM monitoring in place with a 200 ms INP threshold on mobile. Tuesday morning, alert: mobile INP on the articles category jumps from a 145 ms median to 340 ms in the red zone. Cause identified in three hours: a retargeting tag added the day before by the growth team was loading a 240 KB bundle synchronously, saturating the main thread on carousel interactions. The tag was pulled Wednesday, INP came back under 150 ms by Friday. Without monitoring, the team would have noticed three weeks later a drop in time spent on mobile articles without knowing why, and the tag would have stayed live through the end-of-year campaigns.
This kind of detection is the real return on investment from monitoring. The regression is not predictable: it comes from a peripheral decision (a growth team activating a tag) that bypasses the technical process. Without surveillance, these decisions stay invisible until the business aggregate reveals the consequences.
Another common pattern: gradual regression caused by catalog or user-base growth. A site with 200 products per category doesn't have the same INP problem as a site with 2,000. Without long-term trend monitoring, the degradation stays imperceptible until it crosses a critical threshold. Tracking on a rolling three-month window surfaces these slopes before they tip metrics into the red.
CrUX, RUM, synthetic probes: three complementary building blocks
A serious monitoring setup combines three data sources. Each answers a different question. None replaces the others.
CrUX (Chrome UX Report) aggregates field data from Chrome visitors over the last 28 days. It's the truth in Google's eyes, the data used for the Page Experience ranking. The mandatory pillar of any setup. Its limits: monthly granularity, site-level aggregation (not per URL), no fine-grained segmentation. Useful to validate a trend and track the SEO impact of an optimization, insufficient to catch a regression within hours.
In-house RUM (Real User Monitoring instrumented on the site: Datadog, SpeedCurve, Akamai mPulse, Dynatrace, or an open-source option like Boomerang) captures every page view with its actual Core Web Vitals metrics. Fine-grained segmentation, near-real-time aggregation, correlation with business (session, cart, conversion). This is the lever that enables fast regression detection. Its constraints: recurring cost, technical setup, data governance to frame.
Synthetic probes (scheduled WebPageTest, DebugBear, Calibre) run periodically against critical URLs from controlled locations. They don't measure your users, they measure your site against a reproducible profile. Useful to validate the impact of a release before pushing to production, to test scenarios RUM doesn't cover (authenticated pages, complete funnels), to catch a server TTFB regression.
The combination of the three gives a complete system: CrUX for the SEO truth, RUM for fast detection, synthetic for reproducibility and debugging. Picking only one leaves blind spots.
Alerts, thresholds, governance: what separates useful monitoring from noise
A setup that sends 40 alerts a day ends up ignored. A setup that never sends any misses the regressions. Threshold discipline is the heart of exploitable monitoring.
I use three alert levels. The info level, shown on the dashboard without a push notification: a segment slipping into the orange zone, a seven-day trend, an unusual standard deviation. These signals feed the weekly review but don't interrupt anyone. The warning level, daily Slack or email notification to the tech team: confirmed degradation over 24 hours, moving out of the expected range, regression detected after a deploy. The critical level, immediate notification with on-call: a high-traffic segment tipping into the red zone, data collection outage, TTFB doubling in under an hour.
This gradation avoids two classic pitfalls. Alert fatigue, when everything is a priority so nothing is anymore. Deceptive silence, when only the worst triggers a notification and slow degradation slips under the radar.
Monitoring governance also includes a monthly threshold review. Thresholds evolve with the site: catalog grows, traffic goes up, new page types appear. A 2.5 s LCP threshold set a year ago may now be too loose if the site is targeting the top 10% "opportunity" bracket. Revisiting thresholds every quarter keeps monitoring aligned with business goals.
What monitoring does not replace
Monitoring is a surveillance system, not a fix. It detects, it alerts, it documents. It fixes nothing on its own.
Without an initial web performance audit, monitoring produces alerts with no key to interpret them. You know mobile LCP has degraded without knowing why. Reading field data, understanding root causes, prioritizing fixes: this remains the consultant's work. Monitoring feeds the diagnosis, it doesn't replace it.
Without fast intervention capacity on the tech team side, an alert stays an alert. Many companies put monitoring in place then realize they have neither the time, the skills, nor the governance to act on the alerts that come in. The setup becomes a passive dashboard. Monitoring without a paired web performance optimization engagement loses half its value.
Without a shared performance culture across the product and marketing teams, monitoring surfaces regressions no one warns you about. Every tag added without consultation, every feature deployed without a perf review, every plugin activated without testing generates one more alert. Monitoring doesn't replace upstream rules of engagement, it just reveals the need for them.
Frequently asked questions about web performance monitoring
What's the difference between RUM monitoring and synthetic probes?
RUM measures your real users on their own device, in their own network context. It gives an accurate picture of the field experience but doesn't test URLs no one has visited. Synthetic probes run periodically against target URLs from controlled environments. They don't measure users but let you reproduce, compare and alert on precise scenarios. The two complement each other: RUM detects, synthetic explains.
Do I need a paid tool or is an open-source solution enough?
Paid tools (Datadog RUM, SpeedCurve, Akamai mPulse) offer ready-to-use integration, rich dashboards, native multi-criteria segmentation, incident support. Open-source solutions (Boomerang, Sentry Performance, Grafana + custom collection) require in-house expertise but allow full customization and zero recurring cost. The choice depends on team size and traffic volume: above a few hundred thousand monthly sessions, a dedicated tool typically pays for itself within a year.
Can I monitor Core Web Vitals without instrumenting the site?
Partially, through CrUX data that comes from Chrome without instrumentation. The limits: monthly granularity, site-level aggregation, no segmentation by device or geography. Useful to validate a trend but insufficient for reactive steering. Instrumented RUM remains the only option for hourly or daily detection.
How long does a complete setup take?
A basic RUM setup on a SaaS tool goes into production in 1 to 3 days (script integration, segment configuration, dashboard creation). A complete setup with calibrated thresholds, graded alerts, governance review and integration into the release flow takes 2 to 4 weeks. The difference lies in the maturity you want: detecting vs steering.
Which segments should I prioritize on e-commerce?
Mobile product page in France on 24-hour data. It's the segment that weighs most on conversion, that reacts fastest in case of regression, that most quickly triggers action on the team side. All other segments come as enrichment on top of that foundation.
Can monitoring detect an infrastructure problem?
Yes, provided server TTFB is included in the monitored metrics. A field TTFB spike with no application change almost always points to infra: database saturation, CDN scaling issue, degradation of an upstream third-party service. Correlation with server logs then lets you qualify the cause. Monitoring that only reports front-end metrics (LCP, INP, CLS) misses this entire category of regression.